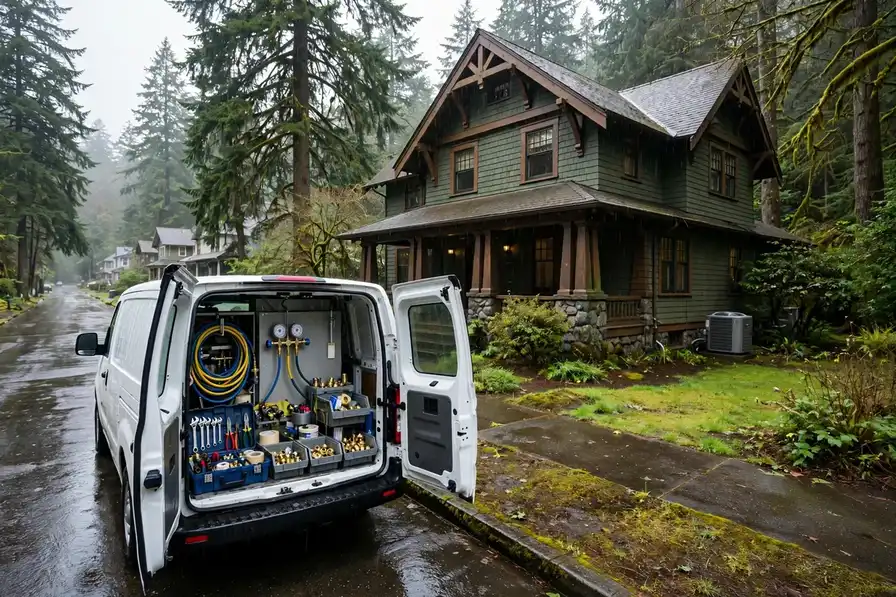


Everything on this page was computed for Portland and nowhere else: the problem ranking from its Census housing profile, the seasonal risks from its NOAA station record, the coverage from its own ZIP codes. TempReach USA connects you to an independent local HVAC technician; the page itself is the homework, done in public, so the call you make is an informed one.
Call center hours: Mon-Fri 7:00 AM-10:00 PM ET | Sat 8:00 AM-10:00 PM ET | Sun 7:00 AM-9:00 PM ET
The median Portland home was built in 1983; 46.2% of the stock predates 1980, and the pattern this metro's own data ranks first is the refrigerant transition reaching older systems. TempReach USA is a referral service, not an HVAC company: one call connects you with an independent local HVAC technician serving your ZIP code.
Two numbers frame everything that follows: 62.0% of Portland homes are owner-occupied, and the median one was built in 1983. Ownership matters to HVAC because owners inherit their systems whole — every equipment decision a builder made in the 1980s or earlier is still in the attic, the closet and the side yard, ageing on its original schedule. With 46.2% of homes predating 1980 and 26.5% arriving since 2000, the metro is really two housing stocks sharing one map, and they are taken separately below before the problems are ranked.
Stand in one of Portland's older neighbourhoods and you are standing in its HVAC's back catalogue. The homes there — part of the 485,307 built before 1980 across this metro — went up when a furnace was built to serve for a generation and central cooling was still spreading street by street. That generation has now elapsed several times over. What it leaves behind is not universal failure but universal exposure: every duct joint, igniter and condenser coil in those districts is operating past the horizon its makers planned for, in Clackamas County and beyond, and the failures arrive in the order the parts tire.
The newer side of Portland — the 26.5% of homes built since 2000, concentrated around growing communities like Portland — runs on matched modern systems that age more gracefully but fail in their own ways: heat pumps and condensers worked hard by 400 cooling degree days of hot-season demand, control boards and sensors wearing out in houses that all reach the same age at the same time. One metro, two equipment generations, and the sections below take them in the order this metro's data ranks them.
Over everything sits the weather, and here it is measured rather than described: NOAA's station at VANCOUVER PEARSON AP, WA US averages 54.0 degrees across the year, with 14.6 days reaching 90 or more and 44.8 nights at freezing or below. A furnace feels that record as a season of relentless cycling; a condenser feels it as a summer without a quiet week; a heat pump feels both. The problem ranking below is what those numbers, crossed with the housing profile, produce for Portland specifically.
Housing eras and climate, joined — the two datasets every section of this page is built from.
Lay the eras side by side instead: 22.2% pre-1960 (233,200 homes), 24.0% from 1960-1979 (252,108), 27.2% from 1980-1999 (285,722), and 26.5% since 2000 (278,369). No single era tells the story — the proportions among them do, and those proportions are different in every metro this site covers.
The 1980-1999 band runs this metro, and its HVAC has a particular flavour: mature but not ancient. Systems old enough to have histories, ducts still sound, equipment from the first efficiency era reaching its wear points in waves, condensers cycling through replacements on a schedule set by whole subdivisions. Portland's is a maintenance-era stock — the decades where attention compounds and neglect starts to invoice.
Behind the leading era, the growth band: 26.5% of homes arrived since 2000. Their systems are uniform by construction — one generation of equipment, one approach to duct design — which writes a shared calendar the whole street keeps. Reading that calendar early is most of what separates a planned replacement from a weekend emergency in Portland's newest districts.
Portland's weather, reduced to what a system experiences: 14.6 hot days a year loading the cooling, 44.8 freezing nights loading the heating, and 37.47 inches of rain feeding the humidity both seasons complain about. NOAA's normals at VANCOUVER PEARSON AP, WA US — 4,400 heating degree days, 400 cooling degree days — are the long average of that experience, and they are why this metro's problem list is not interchangeable with a milder or harsher metro's.
That is the whole method of this page in one section: era shares from the Census, loads from NOAA, and a problem list that is simply where the two overlap most in Portland. The services and guidance that follow are ordered by the same profile — local first, generic last.
Ordered by what this metro's data says its homes need most.
Every repair through TempReach USA follows the same order: diagnosis at the equipment, findings explained, quote given before work begins, and a full test cycle before the technician leaves your Portland home.
Cooling failure in Portland is rarely random. It bunches on the first serious heat wave, again in the late-summer grind, and it concentrates where the equipment is oldest — the pre-1980 districts, 46.2% of the metro's housing — and where the newest subdivisions' identical units reach the same wear points in the same seasons. The technician who works these streets stocks the van for both patterns: the ageing system's slow decline and the young fleet's shared failures. It is why two Portland homes of the same age, on different streets, so often need the same visit in the same year.
The local caseload behind this service is written in the climate figures: 400 cooling degree days a year and 14.6 days at 90 or above, pressing on a cooling fleet whose oldest members serve the 485,307 pre-1980 homes — in Vancouver (192,696 residents) as much as in the oldest districts.
One local habit worth copying: Portland homeowners who mention their street's building era when they book get a better-matched visit, because a technician heading to a the 1980s home in Clackamas County loads different parts than one heading to a new-build subdivision in Vancouver. The service is the same; the preparation is local.
The evidence lives in the returns. Matted dust, debris from construction, hair woven into the load: that is the case for cleaning, made by the ductwork itself. A light film in a tidy system is the case for waiting, and an honest visit says so.
What comes out of a Portland duct system tells the home's biography: drywall dust from the renovation, pet hair in proportion to the household, the fine grit that 37.47 inches of yearly rain and the dry seasons between them work into every return. Cleaning matters most where the biography is long — the pre-1980 homes, 46.2% of the stock — and where a household's breathing argues for it. A technician who shows the before and after, and says plainly when a system does not need the work, is the one whose advice holds up. From Vancouver to Gresham, the pattern repeats wherever the housing era matches.
Count the systems and the diary fills itself: 1,000,418 households breathing through ductwork daily, the oldest of it in homes from the 1980s and the newest in the subdivisions past Hillsboro. What the cleaning finds follows the biography — dust in proportion to years, debris in proportion to renovations.
In Portland this service is booked most often through the problem patterns at the top of this page — the metro's housing data, not habit, sets the order. If your home is in the 46.2% built before 1980, mention its age on the call: it changes the parts the technician loads before heading to Portland and the rest of the metro.
Maintenance is a partnership with a division of labor: the household changes filters and keeps the outdoor unit clear; the professional brings instruments, the checklist and the judgment to read what the measurements are saying.
Ask what a tune-up prevents in Portland and the answer is the peak-season failure: the capacitor that gives out on the first 100-degree afternoon, the condensate switch that floods a closet in the humid weeks, the igniter that chooses the coldest night of January. Those parts announce themselves in advance to anyone measuring — weakening values, slow drains, dirty flame sensors — and the maintenance visit exists to hear the announcements in spring and autumn instead of in the emergency weeks. In Portland that holds across 125 ZIP codes, from Portland out to Gresham.
The maintenance caseload is the installed base itself: 1,050,449 housing units whose systems each face 14.6 hot days and 44.8 freezing nights a year. Around Tigard (55,395 residents) as in the old core, the twice-yearly visit is what stands between that calendar and the emergency diary.
Where this service gets booked in Portland follows the map on this page: the older districts generate the deep-end work, the post-2000 subdivisions the wear-and-tear work, and the 285,722 homes in between split the difference. Telling the call center your home's build decade — most Portland owners know it within a few years — puts the right kit on the van the first time.
The MERV number is a match, not a score. The right filter figure is the highest the blower and ducts can pull air through without strain or bypass — chosen for the furnace in the basement, not the shelf in the store.
Air quality work in Portland also has a quiet economics of attention: the households that measure first — a hygrometer on the wall, the filter inspected monthly against the light — tend to need the least equipment, because they catch the simple causes early: the filter long past its season, the bath fan venting into an attic, the return pulling unconditioned air through a leaky duct in the pre-1980 districts. The assessment visit formalises that attention with instruments, and prescribes in proportion to what it finds. Count it in homes if you prefer: 485,307 built before 1980, 278,369 since 2000, one shared system of streets and seasons.
Air quality demand in this metro is written by its sealed seasons: 14.6 hot days with the windows shut around the cooling, 44.8 freezing nights with them shut around the heat. The 278,369 post-2000 homes hold their air tightest; the older districts around Lake Oswego exchange theirs with attics and crawl spaces.
Where this service gets booked in Portland follows the map on this page: the older districts generate the deep-end work, the post-2000 subdivisions the wear-and-tear work, and the 285,722 homes in between split the difference. Telling the call center your home's build decade — most Portland owners know it within a few years — puts the right kit on the van the first time.
A mini-split heats as completely as it cools; in Portland the cold-climate models' published low-temperature figures decide whether a room can retire its old heaters or keeps them as support.
Ductless systems find their Portland homes where ductwork never went: the older districts' additions and converted spaces, the pre-1960 homes — 22.2% of the metro — built around boilers or gravity heat, the workshops and finished basements of the growth suburbs. A mini-split heats and cools a defined space without asking the house to grow ducts, which is why the assessment starts with the space itself: its exposure, its insulation era, how it is actually used across 14.6 hot days and the winter's coldest weeks. That is the daily reality for the 1,000,418 households spread across Clackamas, Columbia, Multnomah, Washington, Yamhill, Clark, Skamania.
The search territory for ductless is the metro's unducted stock: 233,200 pre-1960 homes built before central systems, plus the additions and conversions scattered through 1,000,418 households — in McMinnville and the historic core alike, spaces the main system never reached.
In Portland this service is booked most often through the problem patterns at the top of this page — the metro's housing data, not habit, sets the order. If your home is in the 46.2% built before 1980, mention its age on the call: it changes the parts the technician loads before heading to Portland and the rest of the metro.
Replacement in Portland begins with a load calculation across Clackamas, Columbia, Multnomah, Washington, Yamhill, Clark, Skamania: the independent local professional measures the home — not the old unit's label — and quotes the full scope before work begins.
Across 125 ZIP codes, Portland heating stock reflects a median build year of 1983 — furnaces at every age, each diagnosed on its own sequence and condition rather than its birthday.
Heating installation in Portland starts with a heat-loss calculation across Clackamas, Columbia, Multnomah, Washington, Yamhill, Clark, Skamania: the independent local professional measures the home's loss, inspects ducts and venting, and quotes the full scope before work begins.
Across 125 ZIP codes and housing from a median build year of 1983, Portland heat pumps are specified and serviced from heat-loss figures and low-temperature performance data, not nominal tonnage.
In Portland, the thermostat question splits by housing era: homes from around the median build year of 1983 often lack a common wire in the wall, while newer builds across the 125 covered ZIP codes usually carry one — the local professional checks the cable before choosing the control.
One call from anywhere in Portland's 125 covered ZIP codes reaches the routing: the failure's details taken, safety advice given on the spot, and the visit sequenced the same way everywhere — safety, stabilization, diagnosis, then repair or an honest scope.
Portland's commercial buildings span every era around a median build year of 1983 — and with the era goes the equipment, from aging single units over old storefronts to multi-zone systems in new developments, all serviced from a per-unit record.
There is a plainer way to say what this page's ranking means in practice: most calls in Portland are two calls. The first answers The refrigerant transition reaching older systems; the second answers leaky ducts losing air and energy. Between them they account for the shape of a local technician's week here — the districts visited, the parts stocked, the diagnoses made fastest because they are made most often. The remaining services divide the rest of the diary among them, essential but episodic, the supporting work around two leading patterns.
Selected and ranked from this metro's housing-age profile and climate record — not copied from another city's page.
There is a paperwork side to the transition that touches Portland homes quietly. Refrigerant work is regulated work: recovery, handling and record-keeping rules apply to whoever services a system, and the newest refrigerants — mildly flammable by classification — arrive with their own sensors, labeling and code provisions that installers must follow. For the homeowner the visible part is small: a nameplate with a different designation, a technician explaining why a charge is measured and documented as it is, an installation that includes leak-detection provisions the older system never had. The invisible part matters more over time: as the newest generation becomes the metro's standard, parts, training and service practice consolidate around it, and the older generations become the specialty work. Owning an older-generation system is not a fault — but its service ecosystem is, year by year, becoming a smaller room.
A transition-aware service visit has a recognizable order. First, identification: the nameplate's refrigerant, model and year, stated aloud so the household and technician share the fact. Second, the leak question, taken seriously — a system low on charge has a leak until proven otherwise, and recharging without finding it is buying the same refrigerant twice on an installment plan. Third, the condition audit around the failure: compressor health, coil condition, electrical wear, because the decision the household faces is about the whole machine, not the one part that stopped. Fourth, the comparison itself, presented as what it is — the repair path with its realistic horizon, the replacement path with its — so the choice is made on the machine's merits and the household's plans for the home. In Portland that conversation, held in a calm season, is unhurried and genuinely optional-feeling; held in a heat wave, the same facts arrive wearing a deadline.
The regulatory facts are the foundation: R-22 production and import ended in the United States in 2020, leaving reclaimed stock as the supply, while new equipment has moved through R-410A to the current lower-impact generation. In Portland every generation still stands in service — the transition is not coming to this metro; it is distributed across it, yard by yard.
There is also a quieter loss running underneath the comfort loss: what leaks out was paid to condition. Every run of the system heats or cools a volume of air; the share that escapes into the attic or crawl space is work done for no room, repeated cycle after cycle, season after season. In a Portland home the arithmetic is worst exactly when the load is highest — the 14.6 hot days push the longest runs through the hottest attics — so the loss curve and the demand curve rise together. Sealing is unglamorous work: mastic on joints, connections re-made and supported, insulation restored where it has fallen. But it is one of the few interventions whose benefit the household can feel at the register on the first run afterward, in air that arrives at the temperature and volume the system produced.
Households judge their heating and cooling at the thermostat, but the thermostat only reports the room it sits in. Judge the system at its furthest register instead: the air arriving there, its temperature against the supply at the unit, its volume against the room's need. In Portland that furthest room is the honest auditor of the duct network — it inherits every leak, every sag and every degree of attic heat between it and the air handler. The homes whose far rooms match their near rooms have networks that were sealed when they were built and checked as they aged. The homes whose far rooms lag are not necessarily homes with weak equipment; they are homes whose delivery network has been quietly resigning, joint by joint, while the equipment took the blame and the service calls. The register, not the nameplate, is where the resignation is announced.
The load figures complete the case: 400 cooling degree days and 4,400 heating degree days at VANCOUVER PEARSON AP, WA US mean the network is in service in earnest at both ends of the year. Duct loss here is not a summer inefficiency or a winter one; it is a twelve-month tax on a system that works both seasons.
There is a stage in every system's life when maintenance stops being a formality and becomes the main event. In Portland, with 485,307 pre-1980 homes and the equipment generations stacked inside them, a large part of the metro lives in that stage permanently. The tune-up of an older system is diagnostic work: pressures and temperatures that reveal a thinning refrigerant charge, electrical readings that show a motor working harder than its nameplate allows, a heat exchanger that deserves eyes rather than assumptions. Done yearly, it converts ageing from a surprise generator into a managed slope — the household learns each year what the system spent and what it has left. Skipped for years, the same visit becomes an archaeology dig, and the findings arrive all at once, usually in the season the household could least use them.
A serious look at an ageing system follows a short order. First, identity: the nameplate's age, model and refrigerant, because those three facts set the realistic horizon. Second, the electrical profile: starting components, motor draws, the condition of connections and the disconnect. Third, the air side: filter, coil cleanliness, blower condition and the temperatures across the system, which together say whether the machine is moving its rated air. Fourth, the combustion side on heating equipment: ignition condition, flame quality, exchanger inspection and venting. Last, the conversation those readings support — what is sound, what is spent, what to watch, and what the household should plan for in which season. In Portland's older housing that order matters more, not less, because the findings compound: an old system behind dirty coils and a drifting charge is three small problems impersonating one large one.
Look at the replacement echoes: the 278,369 homes built since 2000 are now carrying first-generation equipment deep into its service life, joining the older cohorts. In Portland, ageing is not a niche condition of old houses; it is the metro's standard equipment profile.
The condensate drain is the burden's ledger, and in a humid Portland season it runs like a small stream. Every gallon down that drain is water the coil pulled from the indoor air — evidence the system is drying as well as cooling. When the drain slows or clogs, the evidence turns: pans fill, safety switches stop the system, and the moisture the coil collected finds its way back into the house's air and materials. Drain care is therefore not a footnote of humidity work but a central chapter: a clear, trapped, correctly sloped drain line is what lets the system's drying actually leave the building. Households in the metro's humid months who learn to check that one line know more about their system's real condition than the thermostat ever tells them.
Working a humidity complaint follows the water. The first measurements are indoor: relative humidity readings in several rooms, at several times, since a single reading at the thermostat flatters the story. The second look is at the equipment's drying setup — system size against the home's actual load, airflow across the coil, cycle length on a typical afternoon, and the condensate drain's condition and output. The third look is at the sources: crawl space or basement moisture, bathroom and kitchen exhausts that vent into attics instead of outdoors, plumbing weeping quietly somewhere, grade and gutters delivering rainwater to the foundation. Only then does the remedy conversation make sense, because each layer has its own remedy — equipment setup, dedicated dehumidification, ventilation correction, source control — and prescribing from one layer for a problem living in another is how humidity complaints survive multiple service visits.
Housing stacks the burden: Portland's 485,307 pre-1980 homes bring crawl spaces, older envelopes and duct runs through damp air to the contest. The moisture a system must remove is set by the house it serves — and much of this metro's housing imports generously.
Before any equipment enters the conversation, the existing network deserves its audit, because a share of uneven-temperature complaints in Portland are delivery failures wearing a zoning costume. A crushed flex run to the upstairs, a takeoff never opened, returns missing where doors close rooms off from the air's path back — these produce room-to-room differences that no thermostat arrangement can fix, and they correct with duct repairs rather than equipment replacement. The honest sequence is measurement first: temperatures and airflow room by room, the duct map compared against the complaint map, register behavior with doors open and closed. Where the two maps diverge for design reasons, zoning or ductless capacity is the answer; where they diverge for defects, repair is. Households served well get the measurement before the recommendation, because the two answers differ so much in scope that confusing them is the expensive error in either direction.
Judge a multi-room home at its extremes, not at its thermostat. The thermostat sits, by convention, in the home's most average room, and it will report contentment while the nursery roasts and the end office freezes. The extremes are the system's true report card, and in Portland they follow the climate record honestly: 14.6 hot days audit the upstairs, 44.8 freezing nights audit the far rooms over unheated spaces, and the household learns its home's real climate map from the rooms it avoids in each season. Homes whose extremes are comfortable have been sorted — by design, by correction or by dedicated equipment — and homes whose extremes are endured are carrying an unsorted map. The sorting is a solvable problem in essentially every case; what it cannot survive is being mistaken for an equipment failure and treated with a bigger version of the same single answer.
Housing counts the exposure: Portland's 1,050,449 housing units include the multi-storey plans and large footprints of its growth decades — the geometry that manufactures this complaint — alongside the renovated older homes around Portland whose additions rewrote their load maps.
Mild weather is where maintenance goes to be postponed, and Portland's climate is generous enough to allow the postponement for years. The correction is to notice what the gentleness conceals: start components still cycle, refrigerant circuits still seep at joints, condensate still grows its quiet blockages, and outdoor metal still weathers. A single deliberate check a year — both modes run, readings taken, the drain and filter and coil dealt with — asks the household for one appointment and buys back the information the climate declines to provide by force. The systems that surprise their owners in a mild metro are almost never young systems; they are unexamined ones.
The season loads Portland's systems the way its record at VANCOUVER PEARSON AP, WA US says it will: 4,400 heating degree days against 400 cooling degree days in an average year, against a housing stock whose median build year is 1983. The households that read the season early — filters, drains, a system run before the extreme weeks — are the ones whose calls stay schedulable.
In Portland the transition's map is the housing map, lagged by one equipment generation. The districts built around Portland and the the 1980s streets hold the metro's R-22 veterans, in homes that have already seen one full cycle of this story when the equipment before them was young. The middle suburbs hold the R-410A majority. The 278,369 homes built since 2000 carry early current-generation systems now reaching the age where their first major repairs will be quoted — into a market whose standard has already moved on again. Read as a whole, the metro's 1,050,449 housing units contain the refrigerant industry's last several decades standing in rows, and the service economy of the metro is, in part, the business of keeping all those decades running at once. The deep pattern for a homeowner is simple to state and slow to change: your system's generation is a property of your street's building era, and its implications were installed with the house.
Why here and not everywhere: Portland pairs 485,307 pre-1980 homes with 14.6 days a year at 90 degrees or more and 44.8 nights below freezing. Every metro pairs its housing with its weather somehow; this particular pairing is what puts the pattern where it sits on this page's list, ahead of problems that dominate metros built in other decades, under other skies.
Experienced local practice starts with the simple certainties — the observations that take minutes and decide the most:
PROBLEM SOLUTION
Population 642,715
Population 192,696
Population 112,818
Population 107,050
Population 97,502
Population 55,395
Population 53,362
Population 40,367
Population 37,482
Population 34,493
Population 31,700
Population 29,716
Also in the Portland metro: Tualatin (population 27,710), West Linn (population 27,065).
Beyond Portland itself, the metro takes in Vancouver (192,696 residents), Gresham (112,818) and the rest of the communities in the grid above — each fitted with heating and cooling in its own building era, which is why two streets in the same metro can need entirely different HVAC conversations. The ZIP list below is the full coverage footprint: if your code is on it, this page was written about your housing stock.
The map continues: Hillsboro (107,050), Beaverton (97,502), Tigard (55,395), Aloha (53,362), Lake Oswego (40,367). Different names, different decades — each community in Clackamas, Columbia, Multnomah, Washington, Yamhill, Clark, Skamania was fitted with heating and cooling in its own growth years, which is why two streets in the same metro can need entirely different HVAC conversations. The ZIP list below is the working definition of coverage; the housing behind each code is the working definition of the job.
The metro's weight is not evenly spread. Portland holds 642,715 of the 2,510,529 residents; Vancouver and Gresham add 192,696 and 112,818; and the remainder scatters across the smaller places above, some no bigger than a few thousand people. HVAC follows the weight — most calls come from where most homes are — but era matters more than size: a small community of 1960s housing generates older-system work than a large new subdivision does.
Draw the metro by its paperwork and it resolves into Clackamas, Columbia, Multnomah, Washington, Yamhill, Clark, Skamania — 7 jurisdictions sharing one housing stock and one weather system. Clackamas County holds the historic centre and the densest share of the older homes; the surrounding counties hold the rings of growth around it. Permits and inspections follow those boundaries even though temperature never does, which is part of why the technician this page connects you to works these streets specifically.
This page ends at the metro boundary, but the region does not: Salem, OR, Eugene, OR and Bend, OR continue the coverage in their own directions, each with a profile built from its own Census and NOAA figures. If your home sits near the line between metros, go by your ZIP code — it places you in the dataset that describes your housing.
Set Portland among its neighbours and the contrasts sharpen the profile: Salem, OR — metro population 445,814, median build year 1980 — sits 51 miles away; Eugene, OR (381,584, median 1977) 117 miles; Bend, OR (266,376, median 1996) 127 miles. Three different housing stocks under three nearby skies, which is why each keeps its own page and its own problem ranking rather than borrowing this one.
The stock has a shape as well as a size. Owners hold 62.0% of it and renters 38.0%, a split that decides who notices a comfort problem first and who arranges the repair. The generations split 1.7-to-one in favour of the pre-1980 homes. And the map divides into 14 named communities across Clackamas, Columbia, Multnomah, Washington, Yamhill, Clark, Skamania, each carrying its era's share of the 1,050,449 housing units the Census counts here.
Portland by the derived numbers — median home age 43 years · owners in 620,259 homes, renters in 380,159 · each covered ZIP code carrying about 1,866 pre-1960 homes · a heating-to-cooling degree-day ratio of 11.01 · 952 mm average annual rainfall.
County pages carry the local detail — land area, climate normals and the heating and cooling pressures on the ground in each county.
More plain-language help: the TempReach USA heating & cooling guides
TempReach USA routes your call to an independent local heating and cooling professional serving Portland — the assessment and the work are theirs.
Call center hours: Mon-Fri 7:00 AM-10:00 PM ET | Sat 8:00 AM-10:00 PM ET | Sun 7:00 AM-9:00 PM ET