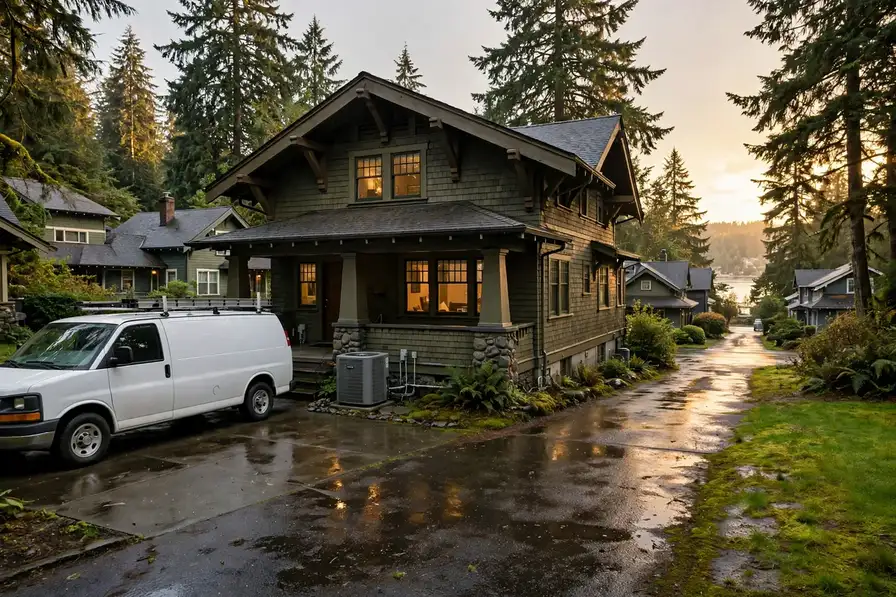


Everything on this page was computed for Olympia and nowhere else: the problem ranking from its Census housing profile, the seasonal risks from its NOAA station record, the coverage from its own ZIP codes. TempReach USA connects you to an independent local HVAC technician; the page itself is the homework, done in public, so the call you make is an informed one.
Call center hours: Mon-Fri 7:00 AM-10:00 PM ET | Sat 8:00 AM-10:00 PM ET | Sun 7:00 AM-9:00 PM ET
The median Olympia home was built in 1991; 34.8% of the stock predates 1980, and the pattern this metro's own data ranks first is the refrigerant transition reaching older systems. TempReach USA is a referral service, not an HVAC company: one call connects you with an independent local HVAC technician serving your ZIP code.
Two numbers frame everything that follows: 67.8% of Olympia homes are owner-occupied, and the median one was built in 1991. Ownership matters to HVAC because owners inherit their systems whole — every equipment decision a builder made in the 1990s or earlier is still in the attic, the closet and the side yard, ageing on its original schedule. With 34.8% of homes predating 1980 and 33.0% arriving since 2000, the metro is really two housing stocks sharing one map, and they are taken separately below before the problems are ranked.
Ask how Olympia's older homes have been kept comfortable and the honest answer is: in pieces. A furnace here, a condenser there, one room's ducts renewed while the rest of the system carries on — across 42,920 pre-1980 homes, the patchwork is the norm rather than the exception. That history is written in the attics of Thurston County and everywhere else the early stock stands: systems that are part original, part renewed, and entirely individual. It is also why the guidance on this page keeps returning to patterns rather than single faults — in a patchwork system, the pattern is the diagnosis.
Growth wrote this metro's newest HVAC chapter in matched equipment and planned ducts: systems sized as a single design, controls by the catalogue, outdoor units placed by the plat across the subdivisions near Olympia and Tumwater. The chapter is young — its systems have decades in hand — but it is not exempt from the metro's arithmetic: 113 cooling degree days of demand work its condensers hard, and the winters test its heat pumps with the same cold that tests the oldest furnace in Thurston County.
The climate written over all of it comes from the NOAA station at OLYMPIA AP, WA US: an average year brings 5,378 heating degree days, 113 cooling degree days and 50.62 inches of precipitation. Those are not abstractions to a furnace or a condenser — they set how many hours a heating system runs each winter, how hard a cooling system cycles in July, and how much moisture every coil has to pull out of the indoor air. The problem sections that follow are selected by exactly these numbers, combined with the housing-age profile above.
Housing eras and climate, joined — the two datasets every section of this page is built from.
Break the stock down by building era and the profile sharpens. Before 1960: 11.2% of homes, roughly 13,813 of them. From 1960 to 1979: 23.6%, about 29,107. From 1980 to 1999: 32.2%, about 39,713. Since 2000: 33.0%, about 40,700. Four eras, four equipment generations — and the balance among them is this metro's HVAC character in a single paragraph.
New-stock metros have their own signature, and Olympia has it in full: most homes built since 2000, most systems young, most HVAC work a matter of waves — the condenser wave, the control-board wave, the first furnace questions — arriving street by street as identical subdivisions age in lockstep. The older pockets still produce the deepest single jobs, but the metro's HVAC centre of mass sits in its newest postcodes, and every year the waves get closer together.
Second in the table, the 1980-1999 band: 39,713 homes, 32.2% of the metro. Its systems are mature rather than ancient — ducts still sound, first-generation efficiency equipment wearing toward its verdicts, controls reaching their wear points in waves — and its HVAC is the schedulable kind: work that rewards being booked before it becomes urgent.
A profile needs its climate column, and Olympia's comes from OLYMPIA AP, WA US: an average year of 50.5 degrees, built from extremes at both ends. The heating load (5,378 degree days) and the cooling load (113) together set the system's working life; the precipitation total (50.62 inches) sets the moisture the cooling half must remove; the freeze count (77.1 nights) sets the stakes of every heating failure. Four numbers — and most of the metro's HVAC behaviour follows from them.
A profile is only useful if it predicts something, and this one predicts the shape of an HVAC diary in Olympia: which streets will call about cooling, which about heating, which about airflow, and in which months. Everything after this section is that prediction written out as services, problems and answers — the numbers first, the narrative second, the way the evidence actually runs.
Listed in the order this metro's housing and climate data supports.
Ice on the line, a tripping breaker, run times that lengthen week by week — in Olympia these are the early chapters of a cooling failure, and a diagnosis caught at that stage is usually a component, not a system.
Ask what fills an AC repair diary in Olympia and the answer is written in its housing. The median home was built in 1991, and a good share of the metro's cooling equipment is older than the homes' current owners realise — units sized for a different era of insulation, charged with refrigerant generations that have since been phased down. A system in Thurston County that cools a little less each summer is telling a story in instalments, and the repair visit reads the whole story: pressures, airflow, the coil's condition, the duct losses behind the walls. In Olympia that holds across 14 ZIP codes, from Lacey out to Tumwater.
Count the exposure from the Census side: a median build year of 1991 across 123,333 housing units means half the metro's air conditioners are older than the systems in the growth suburbs around Olympia, and summer runtime is the statistic that matters — the repair calls follow it street by street.
Three parts, one system: filtration captures what the air carries, humidity control keeps moisture where the building tolerates it, and ventilation replaces stale air on schedule. Equipment chosen for one part cannot do the others' work.
Indoor air in Olympia is a two-season problem. The hot season — 6.4 days at 90 or above — seals homes shut around their air conditioning, and whatever the system recirculates stays in circulation: pollen tracked in during the green months, humidity the coil cannot fully pull down, the ordinary chemistry of a lived-in house. The cold season seals homes the other way, around their heating. Air quality work — filtration, humidity control, ventilation, purification — is sized to that sealed-house reality and to the housing: older homes leak air freely, newer ones hold it tightly, and the remedies differ. That is the daily reality for the 117,172 households spread across Thurston.
Air quality demand in this metro is written by its sealed seasons: 6.4 hot days with the windows shut around the cooling, 77.1 freezing nights with them shut around the heat. The 40,700 post-2000 homes hold their air tightest; the older districts around Tanglewilde exchange theirs with attics and crawl spaces.
In Olympia, the drip from an indoor unit is a drainage story — a clogged line, a failed pump, a route without fall — and it is corrected at the drain path, not wiped up and watched.
Mini-splits also answer a Olympia housing pattern the census tables only hint at: the multigenerational home, the converted space, the workshop that became an office. Across 117,172 households, the rooms that need conditioning keep multiplying faster than duct systems can follow, and a ductless head follows in an afternoon's installation where a duct extension would take a renovation. The assessment stays the same — the space, its exposure, its use — but the question it answers is as much about how the household lives as how the house was built. Ask in Tanglewilde and the answer rhymes with Lacey: same eras, same equipment generations, same calendar of failures.
Scale the question by the Census count and it stays concrete: 123,333 housing units, a share of them holding rooms — additions, conversions, finished spaces — that no duct serves. The mini-split visit exists to give one of those rooms its own climate, sized to its exposure and use.
Across Thurston, the cleaning question is answered the same way — look inside first. From Lacey out through the 14 ZIP codes covered, matted buildup and renovation debris make the case; a light film makes the case for waiting.
From Lacey to Tanglewilde, a no-heat call through TempReach USA reaches a local professional whose visit includes the exchanger and venting checks that furnace work owes a Olympia household.
From Lacey to Tanglewilde, Olympia replacements routed through TempReach USA end in commissioning — measured charge and airflow — so the installed system matches the calculated one.
With 123,333 homes and a median build year of 1991, Olympia heating stock spans every era of furnace and flue — each installation assessed on its own house, not on the outgoing unit's label.
From Lacey to Tanglewilde, Olympia heat pump calls through TempReach USA reach a local professional who explains findings plainly and quotes after assessing — in the heating season and the cooling season alike.
From Lacey to the metro's edge, Olympia's 123,333 homes run every system type there is — single-stage furnaces, two-stage equipment, heat pumps with auxiliary heat — and each gets a control matched to its terminals, not a shelf guess.
Across Thurston, the service record is the scarcest asset: with a median build year of 1991 across 123,333 homes, many systems around Lacey have no documented history — and a first tune-up's baseline is what every later decision stands on.
In Olympia, emergency means weather-relative: 5,378 heating degree days put no-heat calls on a freezing clock each winter, while 113 cooling degree days make a dead system a health question each summer — the call center triages against both, using the hours shown on this page.
Across Thurston, one climate ledger drives the calendar: 5,378 heating degree days and 113 cooling degree days mean roof units work both seasons hard, so the spring and fall visits each carry a full checklist here.
Two patterns generate most of the bookings behind the services above: The refrigerant transition reaching older systems and humidity burden on homes and cooling systems. That is why the order of this page's service list is what it is — the services answering those patterns come early, and the rest follow in the order the metro's data supports. A homeowner whose home matches the local profile — built in the metro's big decades, in one of its older districts — is, statistically, reading their own shortlist.
Ranked for this metro alone, from its Census housing profile and NOAA climate record.
It is worth saying plainly what the transition is not. It is not a mandate to replace working equipment, not a deadline after which older systems become unusable, and not a verdict on the many R-22 and early R-410A systems still cooling Olympia homes adequately. Systems are retired by economics and condition, not by calendar. What the transition changes is the slope of those economics: each year, the older generation's refrigerant and parts grow scarcer while the machine itself grows older, so the repair-versus-replace crossing arrives a little earlier than the same failure would have suggested a decade ago. Honest service practice in this metro states that slope openly and lets the household's own numbers — the unit's age, its condition, its history — make the call. The refrigerant in the pipes has become a fact of the house, like its roof's age: not urgent every day, and unwise to leave unexamined.
The mechanics underneath the policy are simple. A refrigerant is the working fluid of the cooling cycle: it evaporates indoors to absorb heat and condenses outdoors to release it, thousands of times a season. Each generation of fluid was engineered to improve on the last one's environmental profile and operating pressures, and each required its own hardware — compressors built for different pressures, oils that mix with one fluid and not another, metering set for one fluid's characteristics. That is why the generations cannot be swapped like brands of the same product, and why 'topping up' an older system always means its own fluid, sourced from whatever supply its generation still commands. In Olympia, where systems from all three generations stand in neighboring yards, the diversity is a service reality: diagnosis begins with identification, because the same symptom — a system low on charge — carries three different expense structures depending on the nameplate.
Housing arithmetic shows the exposure: with 34.8% of Olympia's homes built before 1980 and equipment replaced in long cycles ever since, a substantial share of the metro's systems belong to refrigerant generations the market has already succeeded. The nameplates say so, one address at a time.
The oversized system is humidity's favorite accomplice. In Olympia, cooling equipment has often been replaced like for like or rounded up in size over the years, and a unit with more capacity than the house needs satisfies the thermostat quickly — then stops, with the coil warming and its collected moisture still in the air stream's neighborhood. Temperature is a fast variable; moisture is a slow one. A house can hit its setting while barely denting its indoor humidity, and the gap between the two is where the clammy afternoons live. Correct sizing, correct airflow and longer, steadier cycles are the equipment side of the answer; the house side — ventilation of wet rooms, vapor sources managed, drainage and grade outside — decides how much burden arrives for the equipment to carry in the first place.
Working a humidity complaint follows the water. The first measurements are indoor: relative humidity readings in several rooms, at several times, since a single reading at the thermostat flatters the story. The second look is at the equipment's drying setup — system size against the home's actual load, airflow across the coil, cycle length on a typical afternoon, and the condensate drain's condition and output. The third look is at the sources: crawl space or basement moisture, bathroom and kitchen exhausts that vent into attics instead of outdoors, plumbing weeping quietly somewhere, grade and gutters delivering rainwater to the foundation. Only then does the remedy conversation make sense, because each layer has its own remedy — equipment setup, dedicated dehumidification, ventilation correction, source control — and prescribing from one layer for a problem living in another is how humidity complaints survive multiple service visits.
The precipitation record testifies first: 50.62 inches of rain in an average year at OLYMPIA AP, WA US means Olympia's air arrives wet for much of the season, and every cooling system in the metro is a dehumidifier by necessity, whether its setup honors the role or not.
Zoning is the structural answer built for exactly this geometry: dampers in the duct network, a thermostat for each zone, and a control that lets the single system answer different areas on different calls. The upstairs can hold its setting without freezing the downstairs; the addition can call without dragging the whole house with it. In Olympia's larger homes — the multi-storey plans that multiplied in the the 1990s decades and after — zoning converts one compromised average into several kept settings. It is not the right answer everywhere: it needs ductwork that can be sectioned sensibly and a system whose sizing and controls suit the arrangement, which is why the assessment starts with the network's map. But where the map allows, zoning answers the complaint at its actual address — the mismatch between one measurement point and a houseful of different needs.
Airflow is the substrate everything else stands on, and its rules are unforgiving. A blower moves a volume of air against the network's resistance; lengthen a run, crush a section, close registers, or clog the path and the volume redistributes itself according to physics, not intention — favoring short, wide, open paths and starving long ones. Balancing is the craft of arranging that redistribution deliberately: damper positions, register adjustment, return paths sized for the supply they serve. In a Olympia home the balance drifts over the years as filters load, furniture rearranges the rooms' air, renovations close paths that used to be open, and duct sections sag or separate. A system can therefore be out of balance without anything being broken — which is both the good news and the diagnostic difficulty, since the remedy is a methodical walk of the whole network rather than a replaced part.
Housing counts the exposure: Olympia's 123,333 housing units include the multi-storey plans and large footprints of its growth decades — the geometry that manufactures this complaint — alongside the renovated older homes around Lacey whose additions rewrote their load maps.
The shoulder season is the system's handover, and like any handover it exposes what the outgoing shift left undone. In Olympia, the spring shoulder inherits winter's account — a filter loaded with the heating season, an igniter that has fired its thousands, heating symptoms nobody acted on once the weather softened — while the autumn shoulder inherits summer's: a coil washed by months of condensate, a drain carrying the season's growth, starting parts worn by the hot months' work. Clearing each inheritance before the next season draws on the account is the whole craft here, and it is light work precisely because the weather, for these few weeks, is not in a hurry.
The season loads Olympia's systems the way its record at OLYMPIA AP, WA US says it will: 5,378 heating degree days against 113 cooling degree days in an average year, against a housing stock whose median build year is 1991. The households that read the season early — filters, drains, a system run before the extreme weeks — are the ones whose calls stay schedulable.
There is a supply-side depth as well. A shrinking refrigerant does not vanish; it circulates — recovered from retired systems, reclaimed to specification, and returned to service at an expense that reflects the shrinking pool. In Olympia that means the R-22 in a system serviced this year may have cooled three other homes before it, and may cool another after this system retires, provided it is recovered rather than vented. The chain gives older equipment a managed twilight rather than a cliff: service remains possible, performed by technicians qualified for the work, for as long as the economics hold for the household. Understanding that chain replaces two common errors — that old systems are already unserviceable, and that they can be serviced forever as cheaply as ever — with the true picture: a gradually tightening supply, a gradually aging fleet, and a decision that improves with information and worsens with delay.
The numbers underneath it, for Olympia: 123,333 housing units, a median build year of 1991, and a climate record at OLYMPIA AP, WA US of 5,378 heating degree days against 113 cooling degree days. Cross the housing record with the weather record and this pattern is what falls out at the top — rarely the most dramatic problem in heating and cooling, but the one this metro's stock and climate manufacture most steadily.
Experienced local practice starts with the simple certainties — the observations that take minutes and decide the most:
PROBLEM SOLUTION
Population 57,088
Population 55,583
Population 26,519
Population 6,822
Population 6,025
Population 2,499
Population 1,965
Population 513
Population 511
The communities in the grid are not suburbs of the page; they are its subject as much as Lacey is. Olympia (55,583 residents) and Tumwater (26,519) carry their own building decades, their own equipment generations and their own positions in the problem ranking's logic — a system under a Olympia roof answers to the same data as one in the centre, but to a different era of it. Coverage here is defined by the ZIP list below; understanding is defined street by street, and this page's figures are the metro-wide version of a story each community tells in its own numbers.
Also on the Olympia map: Tanglewilde (6,822), Rochester (6,025), Rainier (2,499), Tenino (1,965), Nisqually Indian Community (513) — communities spread across Thurston, each with housing from its own growth years. A technician routed through TempReach USA to any of them is working from this same page: the metro data does not change at the city limit, but the housing on your street — its age, its equipment, its attic — is what the visit is really about.
Lacey (57,088 residents) anchors the metro, and Olympia (55,583) is its second centre of gravity. Between them they hold the bulk of the 117,172 households — and, not coincidentally, the bulk of every housing era this page discusses, from the pre-1960 core to the newest subdivisions. Tumwater (26,519) and the communities beyond it repeat the same eras at smaller scale.
The metro answers to 1 county governments (Thurston), a patchwork that matters at permit time rather than at the thermostat. Thurston County carries the centre; the others carry the growth rings and the older outlying towns. A technician routed through this page works inside that patchwork daily — the weather does not care about the boundaries, but the job's paperwork does.
Beyond the metro line, the nearest covered metros are Bremerton, WA (49 miles away), Seattle, WA (59 miles) and Yakima, WA (104 miles) — separate pages, separate profiles, because their housing and weather records are their own. Homeowners near the boundary sit between two datasets; the ZIP list above, not the map's edge, decides which page was written about your stock.
Set Olympia among its neighbours and the contrasts sharpen the profile: Bremerton, WA — metro population 283,374, median build year 1986 — sits 49 miles away; Seattle, WA (4,161,883, median 1985) 59 miles; Yakima, WA (259,185, median 1976) 104 miles. Three different housing stocks under three nearby skies, which is why each keeps its own page and its own problem ranking rather than borrowing this one.
Divide the stock by the map and the densities appear: roughly 8,810 housing units for every covered ZIP code, 117,172 households to a county, 9 named communities in the grid. The balance between the generations reads 1.1 pre-1980 homes for every home built since 2000 — a single ratio that quietly predicts whether a metro's HVAC week leans toward renewal work in the old districts or first-generation upkeep in the new ones.
The Olympia record in one line — median home age: 35 years · owner-occupied homes: 79,443 · renter-occupied homes: 37,729 · pre-1960 homes per covered ZIP code: 987 · heating-to-cooling degree-day ratio: 47.63 · average rainfall: 1,286 mm a year.
County pages carry the local detail — land area, climate normals and the heating and cooling pressures on the ground in each county.
More plain-language help: the TempReach USA heating & cooling guides
Describe the problem and the call center routes you to an independent local HVAC technician who works in the Olympia metro.
Call center hours: Mon-Fri 7:00 AM-10:00 PM ET | Sat 8:00 AM-10:00 PM ET | Sun 7:00 AM-9:00 PM ET