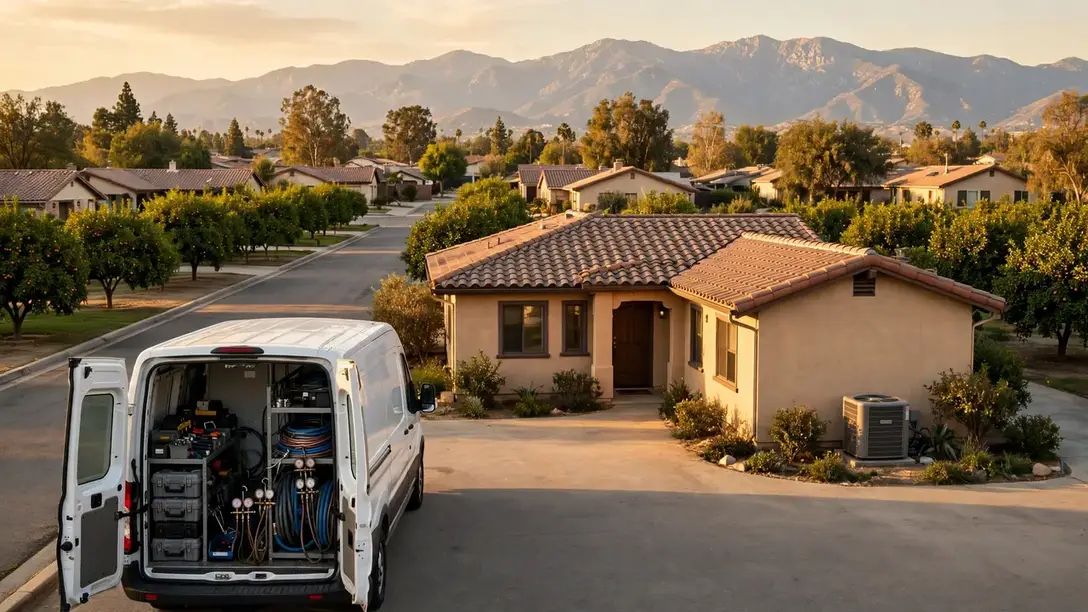


This is Visalia's heating and cooling page, built from Visalia's own numbers: Census housing figures, the metro's ZIP codes and its NOAA climate record. TempReach USA routes your call to an independent local HVAC technician; the homework below is here so you know your home's likely problems before you ever make it.
Call center hours: Mon-Fri 7:00 AM-10:00 PM ET | Sat 8:00 AM-10:00 PM ET | Sun 7:00 AM-9:00 PM ET
The median Visalia home was built in 1983; 45.6% of the stock predates 1980, and the pattern this metro's own data ranks first is the refrigerant transition reaching older systems. TempReach USA is a referral service, not an HVAC company: one call connects you with an independent local HVAC technician serving your ZIP code.
Visalia is a metro of 475,774 people and 142,026 households, and its heating and cooling is a portrait of its building history. The median home here was built in 1983; 45.6% of homes predate 1980 and 17.6% predate 1960, while 25.7% have arrived since 2000. Every one of those eras heated and cooled differently — different furnaces, different duct designs, different refrigerant generations — and they fail differently, which is why this page is organised around the patterns the data actually produces in Visalia rather than HVAC in the abstract.
Ask how Visalia's older homes have been kept comfortable and the honest answer is: in pieces. A furnace here, a condenser there, one room's ducts renewed while the rest of the system carries on — across 69,559 pre-1980 homes, the patchwork is the norm rather than the exception. That history is written in the attics of Tulare County and everywhere else the early stock stands: systems that are part original, part renewed, and entirely individual. It is also why the guidance on this page keeps returning to patterns rather than single faults — in a patchwork system, the pattern is the diagnosis.
Growth wrote this metro's newest HVAC chapter in matched equipment and planned ducts: systems sized as a single design, controls by the catalogue, outdoor units placed by the plat across the subdivisions near Tulare and Porterville. The chapter is young — its systems have decades in hand — but it is not exempt from the metro's arithmetic: 1,868 cooling degree days of demand work its condensers hard, and the winters test its heat pumps with the same cold that tests the oldest furnace in Tulare County.
One more record sits over the whole metro, and it is the one the equipment itself keeps: the weather's. HANFORD MUNI AP, CA US logs 8.13 inches of precipitation in an average year and swings between 112.4 days at 90 degrees or more and 30.7 nights at or below freezing. Heating systems ride that swing in their run hours; cooling systems ride it in their cycle counts; ducts ride it in the attics, expanding and contracting between the seasons. Cross the swing with the housing ages above and the selection of problems further down this page stops looking like a list and starts looking like an arithmetic result.
Housing eras and climate, joined — the two datasets every section of this page is built from.
Lay the eras side by side instead: 17.6% pre-1960 (26,847 homes), 28.0% from 1960-1979 (42,712), 28.7% from 1980-1999 (43,780), and 25.7% since 2000 (39,203). No single era tells the story — the proportions among them do, and those proportions are different in every metro this site covers.
The 1980-1999 band runs this metro, and its HVAC has a particular flavour: mature but not ancient. Systems old enough to have histories, ducts still sound, equipment from the first efficiency era reaching its wear points in waves, condensers cycling through replacements on a schedule set by whole subdivisions. Visalia's is a maintenance-era stock — the decades where attention compounds and neglect starts to invoice.
The second band in the table is the 1960-1979 stock: 42,712 homes, 28.0% of the metro. It is the transition generation — cooling arriving, heating generations overlapping, ducts mixed street by street — and it supplies Visalia with its most diagnostic HVAC: two homes of the same year needing opposite answers, decided by what the builder happened to specify.
A profile needs its climate column, and Visalia's comes from HANFORD MUNI AP, CA US: an average year of 63.4 degrees, built from extremes at both ends. The heating load (2,423 degree days) and the cooling load (1,868) together set the system's working life; the precipitation total (8.13 inches) sets the moisture the cooling half must remove; the freeze count (30.7 nights) sets the stakes of every heating failure. Four numbers — and most of the metro's HVAC behaviour follows from them.
A profile is only useful if it predicts something, and this one predicts the shape of an HVAC diary in Visalia: which streets will call about cooling, which about heating, which about airflow, and in which months. Everything after this section is that prediction written out as services, problems and answers — the numbers first, the narrative second, the way the evidence actually runs.
Selected and ranked from this metro's housing-age profile and climate record — not copied from another city's page.
Planning is where households regain the advantage. A Visalia homeowner who knows their system's refrigerant, age and repair history can run the transition on their own schedule: service the current machine properly, watch the leak-and-wear indicators, and time any replacement for a shoulder season, chosen equipment and an unhurried installation. The homeowner who meets the transition for the first time through a breakdown meets it on the calendar's worst terms — mid-heat, limited deliberation, a decision between an expensive charge on an old machine and a replacement nobody had budgeted to choose that week. The transition itself is the same in both stories; the difference is purely when the household chose to read the nameplate. Technicians in this metro can recite both versions from memory, street by street, because the metro's equipment generations were installed street by street.
A transition-aware service visit has a recognizable order. First, identification: the nameplate's refrigerant, model and year, stated aloud so the household and technician share the fact. Second, the leak question, taken seriously — a system low on charge has a leak until proven otherwise, and recharging without finding it is buying the same refrigerant twice on an installment plan. Third, the condition audit around the failure: compressor health, coil condition, electrical wear, because the decision the household faces is about the whole machine, not the one part that stopped. Fourth, the comparison itself, presented as what it is — the repair path with its realistic horizon, the replacement path with its — so the choice is made on the machine's merits and the household's plans for the home. In Visalia that conversation, held in a calm season, is unhurried and genuinely optional-feeling; held in a heat wave, the same facts arrive wearing a deadline.
Housing arithmetic shows the exposure: with 45.6% of Visalia's homes built before 1980 and equipment replaced in long cycles ever since, a substantial share of the metro's systems belong to refrigerant generations the market has already succeeded. The nameplates say so, one address at a time.
Returns deserve as much suspicion as supplies. A leaking supply loses conditioned air; a leaking return recruits unconditioned air — hot attic air in summer, cold crawl-space air in winter, and with it the dust and moisture of whichever space it crossed. In Visalia's older housing, returns are often the rougher half of the network: panned joist spaces, wall cavities pressed into service, connections made to a standard the era allowed. The symptoms point back confusingly — a system that seems to stir dust, rooms that smell of the attic in summer, humidity the air conditioner cannot quite pull down. A duct assessment that only walks the supply side reads half the network. The returns are where the house breathes in, and a home whose returns breathe from its attic will never quite feel the way the equipment's specifications intend.
Households judge their heating and cooling at the thermostat, but the thermostat only reports the room it sits in. Judge the system at its furthest register instead: the air arriving there, its temperature against the supply at the unit, its volume against the room's need. In Visalia that furthest room is the honest auditor of the duct network — it inherits every leak, every sag and every degree of attic heat between it and the air handler. The homes whose far rooms match their near rooms have networks that were sealed when they were built and checked as they aged. The homes whose far rooms lag are not necessarily homes with weak equipment; they are homes whose delivery network has been quietly resigning, joint by joint, while the equipment took the blame and the service calls. The register, not the nameplate, is where the resignation is announced.
Climate sharpens the accounting: in Visalia the supply runs cross attic air during 112.4 days a year at 90 degrees or more, and crawl-space cold through 30.7 freezing nights. A leak in those spaces is not a small percentage lost politely — it is conditioned air exchanged with the harshest air the house contains.
Heat waves test a metro's cooling stock the way an examination tests a class: all at once, and hardest on whoever was least prepared. In Visalia the preparation is mostly invisible — a clean coil, a healthy capacitor, a correct charge, a filter that is not throttling the airflow. Systems carrying those quiet advantages ride out the 112.4 hot days without drama. Systems missing one of them meet the heat with a handicap, and the handicap compounds daily: a dirty coil raises operating pressures, higher pressures heat the compressor, the heated compressor wears its oil and its windings. The chain is mechanical, not mysterious, and it is why the same heat wave that one street shrugs off fills another street's week with repair calls.
The physics underneath is simple enough. An air conditioner does not create cold; it moves heat from indoors to outdoors, and it moves that heat against the temperature difference between the two. The hotter it is outside, the harder the compressor must work to push heat uphill, and the longer the system must run to hold the same indoor temperature. In Visalia the design assumptions behind older systems were written for a milder version of this contest. A unit installed when the surrounding streets were newer now serves a home with more heat gain — mature trees gone or grown, additions built, attic insulation settled — while its own capacity has thinned with age. The gap between what the house asks and what the unit can give widens a degree at a time, and extreme heat is when the gap becomes a number the thermostat reports every afternoon.
Count the demand the way the equipment experiences it: 1,868 cooling degree days a year, with the peak delivered in afternoons when the temperature difference the system must work against is at its widest. In that arithmetic, a marginal system is not unlucky — it is simply outnumbered.
Ageing also changes what a repair means. On a young system, a failed part is an interruption; on an old one, it is information — a data point about the machine's remaining life and about whether the next failure is already loading. In the older districts of Visalia, around Visalia and the streets that grew with it, technicians read repairs that way and say so: this motor can be replaced, and here is what its failure tells us about the compressor behind it. The household's decision — maintain, repair, or plan a replacement on a calm schedule — is only as good as that reading. Systems do not owe anyone a warning before their last season, but in practice they file their intentions in a language of rising run times and narrowing margins, for those who have the readings taken.
The mechanics of ageing are unglamorous and cumulative. Bearings wear and draw more current. Capacitor values drift downward year by year, weakening every start they assist. Coil surfaces oxidize and foul, shedding their ability to exchange heat a fraction at a time. Refrigerant leaves through seals and joints at a pace too small to notice in a season and large enough to matter in five. Electrical connections loosen under thermal cycling and add resistance that becomes heat. None of these processes stops, but most of them are measurable long before they are fatal — which is precisely what separates maintenance from repair. A tune-up measures the drift; a repair replaces whatever the drift finally claimed. The household that buys measurement regularly buys the choice of when to spend on renewal, and that choice is worth the most on the oldest equipment.
The housing record is the evidence: 17.6% of Visalia's homes predate 1960 and 45.6% predate 1980. Equipment lives and ages inside that stock, so the metro's systems are, as a population, exactly as old as its building history says they should be.
The shoulder season is the system's handover, and like any handover it exposes what the outgoing shift left undone. In Visalia, the spring shoulder inherits winter's account — a filter loaded with the heating season, an igniter that has fired its thousands, heating symptoms nobody acted on once the weather softened — while the autumn shoulder inherits summer's: a coil washed by months of condensate, a drain carrying the season's growth, starting parts worn by the hot months' work. Clearing each inheritance before the next season draws on the account is the whole craft here, and it is light work precisely because the weather, for these few weeks, is not in a hurry.
The season loads Visalia's systems the way its record at HANFORD MUNI AP, CA US says it will: 2,423 heating degree days against 1,868 cooling degree days in an average year, against a housing stock whose median build year is 1983. The households that read the season early — filters, drains, a system run before the extreme weeks — are the ones whose calls stay schedulable.
The closer look reveals an irony at the transition's core. The systems most exposed to it — the oldest refrigerant generation — are concentrated in the homes least able to treat replacement casually: Visalia's older housing, whose owners inherited their equipment's generation along with its era's ductwork and electrical service. For those households the repair-versus-replace decision carries more weight per dollar, and the quality of the conversation matters accordingly. Good local practice in this metro recognizes the stakes explicitly: present the leak, the machine's full condition, and both paths with their honest horizons, and let the decision be the household's, made with the nameplate fact on the table. The transition will complete itself across this metro one household decision at a time; the households served well are the ones whose decisions were informed rather than hurried.
Strip the pattern down to its inputs and the ranking stops being mysterious: 142,026 households depending on systems installed across a median build year of 1983, in a climate that swings between 112.4 days of serious heat and 30.7 freezing nights. Whatever pattern a metro with those inputs manufactures most, it manufactures here — the lead position is less a title than a consequence, recalculated from the same public records any sceptic can check.
The first visit follows a short, diagnostic list — each item ruling a branch of the problem in or out:
Sequenced by this metro's own problem ranking, not by a national catalogue order.
Ice on the line, a tripping breaker, run times that lengthen week by week — in Visalia these are the early chapters of a cooling failure, and a diagnosis caught at that stage is usually a component, not a system.
Cooling failure in Visalia is rarely random. It bunches on the first serious heat wave, again in the late-summer grind, and it concentrates where the equipment is oldest — the pre-1980 districts, 45.6% of the metro's housing — and where the newest subdivisions' identical units reach the same wear points in the same seasons. The technician who works these streets stocks the van for both patterns: the ageing system's slow decline and the young fleet's shared failures. Count it in homes if you prefer: 69,559 built before 1980, 39,203 since 2000, one shared system of streets and seasons.
The local caseload behind this service is written in the climate figures: 1,868 cooling degree days a year and 112.4 days at 90 or above, pressing on a cooling fleet whose oldest members serve the 69,559 pre-1980 homes — in Tulare (69,984 residents) as much as in the oldest districts.
Method separates cleaning from stirring. Negative pressure on the whole network, agitation in every run, registers off and washed, the blower compartment cleared — anything less moves the dust from one room's duct to another's.
A word on timing, since Visalia households ask: duct cleaning earns its appointment when the evidence calls for it — after construction or renovation dust, when a home changes hands after years of one household's accumulation, when the registers show visible load or the blower compartment tells the story. Booked on evidence, it is honest work with visible results. Booked on a calendar superstition, it is a van ride. Local technicians who work from the evidence are the ones this page's routing favours, in Visalia and across the metro alike. That is the daily reality for the 142,026 households spread across Tulare.
Duct demand concentrates in the metro's long-biography homes: 69,559 pre-1980 systems that have carried decades of household air, and the renovated homes around Dinuba (25,201 residents) whose construction dust is still in the runs.
The condition report is the product that outlasts the visit. Specific measurements, watch items named, urgency ranked — and next year's visit comparing against this year's numbers, so drift becomes visible before it becomes failure.
The tune-up diary in Visalia follows the installed base: the pre-1980 districts' ageing systems, kept in service by attention; the middle ring's equipment in its second decade, where maintenance decides whether it sees a third; the subdivisions' matched fleets, all reaching the same service points in the same seasons. A maintenance visit is measurement more than ritual — temperatures, pressures, electrical readings, airflow — recorded against last year's figures, so the system's direction is known rather than guessed. It is why two Visalia homes of the same age, on different streets, so often need the same visit in the same year.
Tune-up demand follows the fleet's waves: the subdivisions' matched systems reaching service points together, the pre-1980 districts' individual units on individual schedules. Farmersville sits inside one of those patterns; the readings taken there this season predict its systems' next one.
Across Tulare, the housing split decides the starting point: older, leakier homes around Visalia usually need filtration and moisture work first, while tighter newer builds in the 40 covered ZIP codes usually need deliberate ventilation most.
With a median build year of 1983, many Visalia systems are reaching replacement age together; the professional you are connected with inspects ducts and electrics across 40 ZIP codes before recommending equipment.
Across 40 ZIP codes, Visalia heating stock reflects a median build year of 1983 — furnaces at every age, each diagnosed on its own sequence and condition rather than its birthday.
Heating installation in Visalia starts with a heat-loss calculation across Tulare: the independent local professional measures the home's loss, inspects ducts and venting, and quotes the full scope before work begins.
Across 40 ZIP codes and housing from a median build year of 1983, Visalia heat pumps are specified and serviced from heat-loss figures and low-temperature performance data, not nominal tonnage.
From period homes near Visalia to newer builds toward Dinuba, Visalia's ductless projects serve the rooms central systems miss — additions, conversions and homes built without ductwork.
Across Tulare, one climate fact shapes the configuration: 2,423 heating degree days against 1,868 cooling degree days tells whether the control's year is mostly a heating story, mostly a cooling story, or a genuine heat pump balancing act.
One call from anywhere in Visalia's 40 covered ZIP codes reaches the routing: the failure's details taken, safety advice given on the spot, and the visit sequenced the same way everywhere — safety, stabilization, diagnosis, then repair or an honest scope.
In Visalia, commercial work follows the stock: 152,542 housing units' worth of mixed buildings — offices, retail and restaurants from Visalia across the 40 covered ZIP codes — each with rooftop units whose service rhythm the local professional sets per building.
There is a plainer way to say what this page's ranking means in practice: most calls in Visalia are two calls. The first answers The refrigerant transition reaching older systems; the second answers leaky ducts losing air and energy. Between them they account for the shape of a local technician's week here — the districts visited, the parts stocked, the diagnoses made fastest because they are made most often. The remaining services divide the rest of the diary among them, essential but episodic, the supporting work around two leading patterns.
PROBLEM SOLUTION
Population 142,649
Population 69,984
Population 62,765
Population 25,201
Population 12,572
Population 10,336
Population 10,280
Population 9,607
Population 8,679
Population 7,716
Population 7,651
Population 4,895
Also in the Visalia metro: East Porterville (population 4,567), Ivanhoe (population 4,397).
Read the grid as a building programme spread over a century. The oldest communities sit where the metro began; the youngest are still adding streets at its edge; and Tulare and Porterville, with 69,984 and 62,765 residents, stand for the rings in between. Each ring was fitted in its era's equipment, and each is now failing, wearing or holding in its era's characteristic order. The ZIP codes below draw the coverage boundary; the eras inside it draw everything else on this page — the problems ranked, the services ordered, the checks advised.
The map continues: Dinuba (25,201), Lindsay (12,572), Farmersville (10,336), Exeter (10,280), Orange Cove (9,607). Different names, different decades — each community in Tulare was fitted with heating and cooling in its own growth years, which is why two streets in the same metro can need entirely different HVAC conversations. The ZIP list below is the working definition of coverage; the housing behind each code is the working definition of the job.
Visalia (142,649 residents) anchors the metro, and Tulare (69,984) is its second centre of gravity. Between them they hold the bulk of the 142,026 households — and, not coincidentally, the bulk of every housing era this page discusses, from the pre-1960 core to the newest subdivisions. Porterville (62,765) and the communities beyond it repeat the same eras at smaller scale.
Draw the metro by its paperwork and it resolves into Tulare — 1 jurisdictions sharing one housing stock and one weather system. Tulare County holds the historic centre and the densest share of the older homes; the surrounding counties hold the rings of growth around it. Permits and inspections follow those boundaries even though temperature never does, which is part of why the technician this page connects you to works these streets specifically.
Three neighbouring coverage areas begin where this one ends: Hanford, CA, some 59 miles off; Bakersfield, CA, 61 miles; and Fresno, CA, 73 miles. Each keeps its own page because each keeps its own numbers — a different median build year, a different climate station, a different problem ranking. Boundary households should trust the ZIP list over the map: the code, not the compass, assigns the dataset.
The region around Visalia is a set of variations on its theme: Hanford, CA, 59 miles off, runs a median build year of 1986 on a metro population of 154,327; Bakersfield, CA (61 miles) medians 1984 on 927,068; Fresno, CA (73 miles) medians 1982 on 1,203,383. Nearness is not sameness — a few decades of median build year separate their heating and cooling as surely as the miles separate their maps.
Count the metro per unit of itself: 3,814 housing units per covered ZIP code; 142,026 households per county; 14 communities sharing 1 county governments. Then weigh the generations against each other — 1.8 older homes for each newer one — and the service pattern on this page stops being a list and becomes a proportion: that much of the diary written by ageing systems, the rest by young ones wearing in.
The Visalia record in one line — median home age: 43 years · owner-occupied homes: 83,227 · renter-occupied homes: 58,799 · pre-1960 homes per covered ZIP code: 671 · heating-to-cooling degree-day ratio: 1.3 · average rainfall: 207 mm a year.
County pages carry the local detail — land area, climate normals and the heating and cooling pressures on the ground in each county.
More plain-language help: the TempReach USA heating & cooling guides
Describe the problem and the call center routes you to an independent local HVAC technician who works in the Visalia metro.
Call center hours: Mon-Fri 7:00 AM-10:00 PM ET | Sat 8:00 AM-10:00 PM ET | Sun 7:00 AM-9:00 PM ET