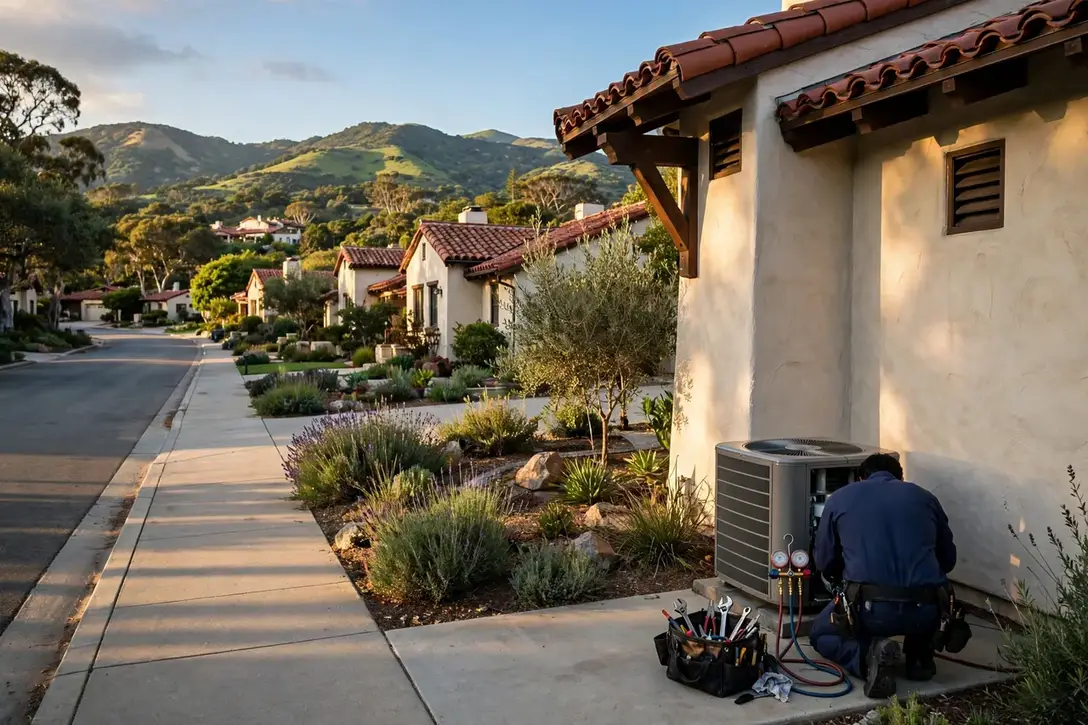


Everything on this page was computed for San Luis Obispo and nowhere else: the problem ranking from its Census housing profile, the seasonal risks from its NOAA station record, the coverage from its own ZIP codes. TempReach USA connects you to an independent local HVAC technician; the page itself is the homework, done in public, so the call you make is an informed one.
Call center hours: Mon-Fri 7:00 AM-10:00 PM ET | Sat 8:00 AM-10:00 PM ET | Sun 7:00 AM-9:00 PM ET
The median San Luis Obispo home was built in 1983; 44.5% of the stock predates 1980, and the pattern this metro's own data ranks first is the refrigerant transition reaching older systems. TempReach USA is a referral service, not an HVAC company: one call connects you with an independent local HVAC technician serving your ZIP code.
San Luis Obispo is a metro of 281,486 people and 108,897 households, and its heating and cooling is a portrait of its building history. The median home here was built in 1983; 44.5% of homes predate 1980 and 15.9% predate 1960, while 23.4% have arrived since 2000. Every one of those eras heated and cooled differently — different furnaces, different duct designs, different refrigerant generations — and they fail differently, which is why this page is organised around the patterns the data actually produces in San Luis Obispo rather than HVAC in the abstract.
Ask how San Luis Obispo's older homes have been kept comfortable and the honest answer is: in pieces. A furnace here, a condenser there, one room's ducts renewed while the rest of the system carries on — across 55,568 pre-1980 homes, the patchwork is the norm rather than the exception. That history is written in the attics of San Luis Obispo County and everywhere else the early stock stands: systems that are part original, part renewed, and entirely individual. It is also why the guidance on this page keeps returning to patterns rather than single faults — in a patchwork system, the pattern is the diagnosis.
The growth side of the metro tells the opposite story in the same language. El Paso de Robles (Paso Robles), Atascadero and the subdivisions still filling in account for much of the 29,220 homes built since 2000 — matched systems, planned ductwork, heat pumps where the lots suit them. Their HVAC is not old; it is uniform, which creates its own calendar: everything installed in the same boom reaches each wear point in the same years, from the first condenser replacements to the first control-board failures, while 334 cooling degree days of annual heat keep demand on the system high.
The weather's part in this is written at SAN LUIS OBISPO AP, CA US, where an average year carries 17.94 inches of precipitation, 14.5 days at ninety degrees or more and 8.0 nights at freezing or below. Systems experience that year as workload and as stakes in roughly equal measure — the workload in the run hours, the stakes on the single coldest night and the single hottest week. The problem ranking further down is simply the housing profile above, read under this sky.
Two public records, one metro: what was built here, and what the sky does to it.
The distribution, in one breath: of every hundred San Luis Obispo homes, 15.9 were standing before 1960, 28.6 went up in the two decades after, 32.1 in the two after that, and 23.4 have arrived since 2000. Percentages flatten the picture, so hold the counts beside them — 19,854 oldest-era homes, 29,220 newest — and the metro's heating and cooling stops being an abstraction: it is that many systems, of those ages, failing in that order.
This metro's stock was mostly built in HVAC's transitional decades, 1980 to 1999, and it shows a particular failure calendar: not the deep-design sagas of the old metros, but the wear-out wave of everything installed in those years arriving together — capacitors, igniters, control boards, the first of the modern systems ageing into their verdicts. San Luis Obispo's HVAC story for the next decade is largely written: it is the story of that installed base reaching its limits neighbourhood by neighbourhood.
The second band in the table is the 1960-1979 stock: 35,713 homes, 28.6% of the metro. It is the transition generation — cooling arriving, heating generations overlapping, ducts mixed street by street — and it supplies San Luis Obispo with its most diagnostic HVAC: two homes of the same year needing opposite answers, decided by what the builder happened to specify.
Translate the climate record into HVAC terms and it comes out as three working conditions. Condition one, the freeze count — 8.0 nights a year when a heating failure stops being a comfort issue and becomes a household one. Condition two, the heat count — 14.5 days that load condensers, ducts and tempers simultaneously. Condition three, the moisture: 17.94 inches of precipitation arriving as humidity the cooling coil must remove. San Luis Obispo's systems are engineered, installed and aged inside those three conditions, and their failures carry the conditions' fingerprints.
That is the whole method of this page in one section: era shares from the Census, loads from NOAA, and a problem list that is simply where the two overlap most in San Luis Obispo. The services and guidance that follow are ordered by the same profile — local first, generic last.
Listed in the order this metro's housing and climate data supports.
Age informs an AC repair decision without deciding it — a sound system with a failed motor earns its repair, and an honest diagnosis in San Luis Obispo will tell you which side of that line your unit stands on.
Air conditioning in San Luis Obispo works against the local calendar: 334 cooling degree days a year at SAN LUIS OBISPO AP, CA US, with 14.5 days at 90 degrees or more. The failures follow that load — capacitors and contactors worn by relentless summer cycling, refrigerant charges drifting low on systems that have served a decade of heat, condensate drains clogging in the humid weeks. The older districts run the oldest condensers; the subdivisions around San Luis Obispo run matched fleets installed in the same seasons, and both sides of the metro meet the repair call on the hottest week of the year. From El Paso de Robles (Paso Robles) to Atascadero, the pattern repeats wherever the housing era matches.
The local caseload behind this service is written in the climate figures: 334 cooling degree days a year and 14.5 days at 90 or above, pressing on a cooling fleet whose oldest members serve the 55,568 pre-1980 homes — in El Paso de Robles (Paso Robles) (31,399 residents) as much as in the oldest districts.
Method separates cleaning from stirring. Negative pressure on the whole network, agitation in every run, registers off and washed, the blower compartment cleared — anything less moves the dust from one room's duct to another's.
Ducts in San Luis Obispo collect what the metro's life sends through them: construction dust in the growth subdivisions, decades of household dust in the older districts, pollen riding the return air through long pollen seasons. The honest framing for cleaning is the system's condition, not a calendar — a duct system in a the 1980s home that has been remodelled twice carries a different load from one in a new build near El Paso de Robles (Paso Robles). The cleaning visit itself is agitation and extraction under negative pressure, register by register, with the blower compartment and coil inspected while access is open. Count it in homes if you prefer: 55,568 built before 1980, 29,220 since 2000, one shared system of streets and seasons.
Count the systems and the diary fills itself: 108,897 households breathing through ductwork daily, the oldest of it in homes from the 1980s and the newest in the subdivisions past Arroyo Grande. What the cleaning finds follows the biography — dust in proportion to years, debris in proportion to renovations.
Heating visits carry a safety core the cooling visit does not: burners, ignition, heat exchanger and venting inspected while the household is not depending on them nightly. Comfort is the other half of the visit, not the whole of it.
The tune-up diary in San Luis Obispo follows the installed base: the pre-1980 districts' ageing systems, kept in service by attention; the middle ring's equipment in its second decade, where maintenance decides whether it sees a third; the subdivisions' matched fleets, all reaching the same service points in the same seasons. A maintenance visit is measurement more than ritual — temperatures, pressures, electrical readings, airflow — recorded against last year's figures, so the system's direction is known rather than guessed. It is why two San Luis Obispo homes of the same age, on different streets, so often need the same visit in the same year.
The maintenance caseload is the installed base itself: 124,871 housing units whose systems each face 14.5 hot days and 8.0 freezing nights a year. Around Los Osos (15,048 residents) as in the old core, the twice-yearly visit is what stands between that calendar and the emergency diary.
In San Luis Obispo, air work follows the climate ledger: 2,265 heating degree days dry the indoor air out each winter while 334 cooling degree days load it with humidity each summer — most homes here need the humidity answer in both directions across the year.
Across 23 ZIP codes, San Luis Obispo mini-split systems installed through local professionals are commissioned zone by zone in heating and cooling, with the filter and drain routine handed over in person.
Replacement in San Luis Obispo begins with a load calculation across San Luis Obispo: the independent local professional measures the home — not the old unit's label — and quotes the full scope before work begins.
Furnace repair in San Luis Obispo follows the sequence: the independent local professional covering San Luis Obispo watches your furnace attempt a start, tests the stage that failed, and quotes before work begins.
Heating installation in San Luis Obispo starts with a heat-loss calculation across San Luis Obispo: the independent local professional measures the home's loss, inspects ducts and venting, and quotes the full scope before work begins.
Across 23 ZIP codes and housing from a median build year of 1983, San Luis Obispo heat pumps are specified and serviced from heat-loss figures and low-temperature performance data, not nominal tonnage.
From San Luis Obispo to the metro's edge, San Luis Obispo's 124,871 homes run every system type there is — single-stage furnaces, two-stage equipment, heat pumps with auxiliary heat — and each gets a control matched to its terminals, not a shelf guess.
Across San Luis Obispo, the local professional who answers knows the stock — a median build year of 1983 across 124,871 homes means systems of every age failing in their characteristic ways, from San Luis Obispo to the metro's newest subdivisions.
Across San Luis Obispo, one climate ledger drives the calendar: 2,265 heating degree days and 334 cooling degree days mean roof units work both seasons hard, so the spring and fall visits each carry a full checklist here.
If this page's services were ranked by San Luis Obispo's call patterns rather than listed in catalogue order, they would come out much as they do here — because the ranking behind them is data, not habit. The refrigerant transition reaching older systems leads the metro's problem table and leaky ducts losing air and energy follows, so the services answering them lead the list. The long tail of a metro's HVAC life — thermostat calls, duct questions, the one room that never matches the rest — fills in the diary around them, here as everywhere.
Selected and ranked from this metro's housing-age profile and climate record — not copied from another city's page.
Planning is where households regain the advantage. A San Luis Obispo homeowner who knows their system's refrigerant, age and repair history can run the transition on their own schedule: service the current machine properly, watch the leak-and-wear indicators, and time any replacement for a shoulder season, chosen equipment and an unhurried installation. The homeowner who meets the transition for the first time through a breakdown meets it on the calendar's worst terms — mid-heat, limited deliberation, a decision between an expensive charge on an old machine and a replacement nobody had budgeted to choose that week. The transition itself is the same in both stories; the difference is purely when the household chose to read the nameplate. Technicians in this metro can recite both versions from memory, street by street, because the metro's equipment generations were installed street by street.
Judge a refrigerant-era system by its leak history and its trend, not by a single charge reading. One low reading after many tight years is an event; a pattern of small losses is a biography, and the biography is what the economics should be based on. San Luis Obispo's climate record loads the question at both ends — a leaking system underperforms exactly when SAN LUIS OBISPO AP, CA US's 14.5 hot days demand its full capacity, and its owner pays for refrigerant and lost performance simultaneously. The households that navigate this transition well keep one habit: they can state their system's age, refrigerant and last three repairs without looking them up. That small command of the facts converts an industry-wide generational change into a single household's managed decision, which is the scale at which it was always going to be decided anyway.
Housing arithmetic shows the exposure: with 44.5% of San Luis Obispo's homes built before 1980 and equipment replaced in long cycles ever since, a substantial share of the metro's systems belong to refrigerant generations the market has already succeeded. The nameplates say so, one address at a time.
There is also a quieter loss running underneath the comfort loss: what leaks out was paid to condition. Every run of the system heats or cools a volume of air; the share that escapes into the attic or crawl space is work done for no room, repeated cycle after cycle, season after season. In a San Luis Obispo home the arithmetic is worst exactly when the load is highest — the 14.5 hot days push the longest runs through the hottest attics — so the loss curve and the demand curve rise together. Sealing is unglamorous work: mastic on joints, connections re-made and supported, insulation restored where it has fallen. But it is one of the few interventions whose benefit the household can feel at the register on the first run afterward, in air that arrives at the temperature and volume the system produced.
Read a duct system the way a technician does and the examination has a shape: start at the air handler and work outward. At the plenum, connections are inspected where they are most stressed and most consequential. Along the runs, the checks are for the known failure family — separated joints, fallen insulation, sagging flex, crushed sections, takeoffs that were sealed with hope rather than mastic. At the registers, temperatures and airflow are compared room by room, and the map of strong and weak rooms is laid over the map of the runs themselves; the two maps explain each other with remarkable consistency. Returns get the same walk, with attention to panned cavities and any path that lets the system breathe from outside the envelope. Cleaning belongs in this picture where the inspection finds accumulation — but cleaning a leaking network without sealing it polishes the inside of a system that is losing its cargo through the walls.
The housing numbers frame the exposure: 124,871 housing units in San Luis Obispo, a median build year of 1983, and duct networks installed era by era in attics, crawl spaces and wall cavities. Every one of those networks is a set of joints ageing in the dark — the loss pool is the size of the metro itself.
Ageing also changes what a repair means. On a young system, a failed part is an interruption; on an old one, it is information — a data point about the machine's remaining life and about whether the next failure is already loading. In the older districts of San Luis Obispo, around San Luis Obispo and the streets that grew with it, technicians read repairs that way and say so: this motor can be replaced, and here is what its failure tells us about the compressor behind it. The household's decision — maintain, repair, or plan a replacement on a calm schedule — is only as good as that reading. Systems do not owe anyone a warning before their last season, but in practice they file their intentions in a language of rising run times and narrowing margins, for those who have the readings taken.
Judge an ageing system by its trend line, never by its kindest day. On its kindest day — mild weather, light load — almost any system in San Luis Obispo can still argue for itself. The trend line is written elsewhere: in run times lengthening season over season, in the setting creeping to hold the same comfort, in the rooms that quietly dropped out of the system's reach. SAN LUIS OBISPO AP, CA US's climate record ensures the trend will be tested at both ends of the year — 14.5 hot days and 8.0 freezing nights in an average year. The households that read their trend early choose the terms of the ending, whether that ending is a renewed component, a planned replacement in a shoulder season, or a few more good years bought with honest maintenance. The households that wait for the system's verdict receive it in the weather least suited to hearing it.
Look at the replacement echoes: the 29,220 homes built since 2000 are now carrying first-generation equipment deep into its service life, joining the older cohorts. In San Luis Obispo, ageing is not a niche condition of old houses; it is the metro's standard equipment profile.
Mild weather is where maintenance goes to be postponed, and San Luis Obispo's climate is generous enough to allow the postponement for years. The correction is to notice what the gentleness conceals: start components still cycle, refrigerant circuits still seep at joints, condensate still grows its quiet blockages, and outdoor metal still weathers. A single deliberate check a year — both modes run, readings taken, the drain and filter and coil dealt with — asks the household for one appointment and buys back the information the climate declines to provide by force. The systems that surprise their owners in a mild metro are almost never young systems; they are unexamined ones.
The season loads San Luis Obispo's systems the way its record at SAN LUIS OBISPO AP, CA US says it will: 2,265 heating degree days against 334 cooling degree days in an average year, against a housing stock whose median build year is 1983. The households that read the season early — filters, drains, a system run before the extreme weeks — are the ones whose calls stay schedulable.
In San Luis Obispo the transition's map is the housing map, lagged by one equipment generation. The districts built around San Luis Obispo and the the 1980s streets hold the metro's R-22 veterans, in homes that have already seen one full cycle of this story when the equipment before them was young. The middle suburbs hold the R-410A majority. The 29,220 homes built since 2000 carry early current-generation systems now reaching the age where their first major repairs will be quoted — into a market whose standard has already moved on again. Read as a whole, the metro's 124,871 housing units contain the refrigerant industry's last several decades standing in rows, and the service economy of the metro is, in part, the business of keeping all those decades running at once. The deep pattern for a homeowner is simple to state and slow to change: your system's generation is a property of your street's building era, and its implications were installed with the house.
Read the ranking backwards and it reads as a data summary: 281,486 residents in 124,871 housing units, 15.9% of the housing from before 1960, 17.94 inches of rain in an average year. The pattern leads because the exposure is broad — counted not in individual unlucky houses but in whole eras of the metro's building, stacked one on another.
On a first visit for this pattern, a local technician's checks run in a practised order:
PROBLEM SOLUTION
Population 48,039
Population 31,399
Population 29,735
Population 18,412
Population 17,266
Population 15,048
Population 12,687
Population 10,717
Population 8,608
Population 8,024
Population 7,529
Population 7,098
Also in the San Luis Obispo metro: Cambria (population 6,038), Lake Nacimiento (population 3,464).
Read the grid as a building programme spread over a century. The oldest communities sit where the metro began; the youngest are still adding streets at its edge; and El Paso de Robles (Paso Robles) and Atascadero, with 31,399 and 29,735 residents, stand for the rings in between. Each ring was fitted in its era's equipment, and each is now failing, wearing or holding in its era's characteristic order. The ZIP codes below draw the coverage boundary; the eras inside it draw everything else on this page — the problems ranked, the services ordered, the checks advised.
Also on the San Luis Obispo map: Arroyo Grande (18,412), Nipomo (17,266), Los Osos (15,048), Grover Beach (12,687), Morro Bay (10,717) — communities spread across San Luis Obispo, each with housing from its own growth years. A technician routed through TempReach USA to any of them is working from this same page: the metro data does not change at the city limit, but the housing on your street — its age, its equipment, its attic — is what the visit is really about.
Start with San Luis Obispo itself: 48,039 residents, 17.1% of the metro — the centre the rest of the map orbits. El Paso de Robles (Paso Robles) (31,399) and Atascadero (29,735) form the next ring out, housing with its own building decades and its own equipment generations. Beyond them the metro thins into the smaller communities in the grid above, each a few thousand households deep — small in population, identical in one respect: their systems answer to the same eras and the same weather as the big city's.
Administratively the metro is drawn from San Luis Obispo — 1 in all — with San Luis Obispo County at its centre. County lines do not change how a system runs, but they do shape the paperwork around the work: permits, inspections and code details are county and city business, which is one reason the professional who serves your street is a local one.
This page ends at the metro boundary, but the region does not: Hanford, CA, Santa Barbara, CA and Salinas, CA continue the coverage in their own directions, each with a profile built from its own Census and NOAA figures. If your home sits near the line between metros, go by your ZIP code — it places you in the dataset that describes your housing.
Set San Luis Obispo among its neighbours and the contrasts sharpen the profile: Hanford, CA — metro population 154,327, median build year 1986 — sits 59 miles away; Santa Barbara, CA (442,065, median 1974) 63 miles; Salinas, CA (433,729, median 1975) 76 miles. Three different housing stocks under three nearby skies, which is why each keeps its own page and its own problem ranking rather than borrowing this one.
Divide the stock by the map and the densities appear: roughly 5,429 housing units for every covered ZIP code, 108,897 households to a county, 14 named communities in the grid. The balance between the generations reads 1.9 pre-1980 homes for every home built since 2000 — a single ratio that quietly predicts whether a metro's HVAC week leans toward renewal work in the old districts or first-generation upkeep in the new ones.
One line of San Luis Obispo arithmetic — a median home 43 years old · 67,407 owner-occupied homes against 41,490 renter-occupied · 863 pre-1960 homes for every covered ZIP code · a heating-to-cooling degree-day ratio of 6.77 · 456 mm of rain in an average year.
County pages carry the local detail — land area, climate normals and the heating and cooling pressures on the ground in each county.
More plain-language help: the TempReach USA heating & cooling guides
Describe the problem and the call center routes you to an independent local HVAC technician who works in the San Luis Obispo metro.
Call center hours: Mon-Fri 7:00 AM-10:00 PM ET | Sat 8:00 AM-10:00 PM ET | Sun 7:00 AM-9:00 PM ET