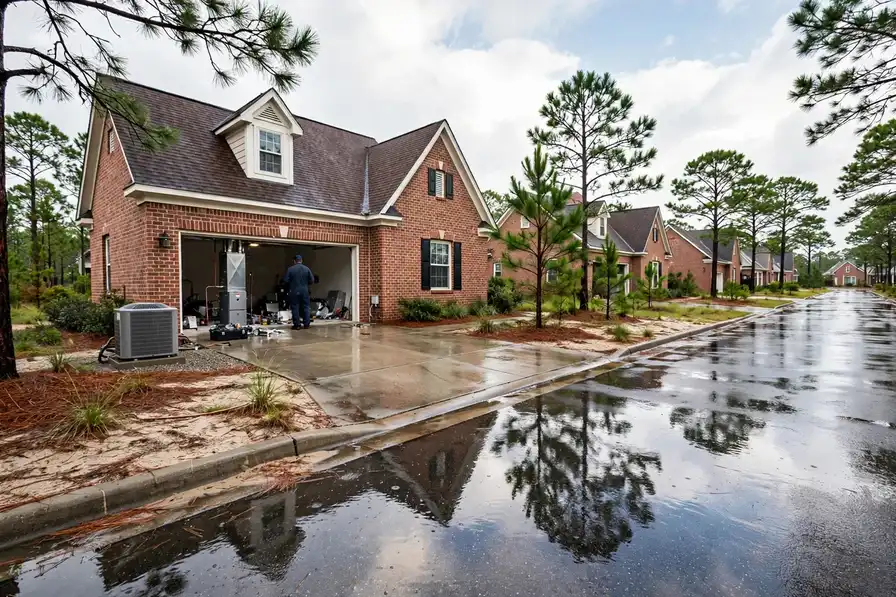


Everything on this page was computed for Virginia Beach–Norfolk and nowhere else: the problem ranking from its Census housing profile, the seasonal risks from its NOAA station record, the coverage from its own ZIP codes. TempReach USA connects you to an independent local HVAC technician; the page itself is the homework, done in public, so the call you make is an informed one.
Call center hours: Mon-Fri 7:00 AM-10:00 PM ET | Sat 8:00 AM-10:00 PM ET | Sun 7:00 AM-9:00 PM ET
The median Virginia Beach–Norfolk home was built in 1983; 44.7% of the stock predates 1980, and the pattern this metro's own data ranks first is the refrigerant transition reaching older systems. TempReach USA is a referral service, not an HVAC company: one call connects you with an independent local HVAC technician serving your ZIP code.
Virginia Beach–Norfolk is a metro of 1,782,590 people and 701,116 households, and its heating and cooling is a portrait of its building history. The median home here was built in 1983; 44.7% of homes predate 1980 and 18.9% predate 1960, while 23.2% have arrived since 2000. Every one of those eras heated and cooled differently — different furnaces, different duct designs, different refrigerant generations — and they fail differently, which is why this page is organised around the patterns the data actually produces in Virginia Beach–Norfolk rather than HVAC in the abstract.
Stand in one of Virginia Beach–Norfolk's older neighbourhoods and you are standing in its HVAC's back catalogue. The homes there — part of the 339,031 built before 1980 across this metro — went up when a furnace was built to serve for a generation and central cooling was still spreading street by street. That generation has now elapsed several times over. What it leaves behind is not universal failure but universal exposure: every duct joint, igniter and condenser coil in those districts is operating past the horizon its makers planned for, in Camden County and beyond, and the failures arrive in the order the parts tire.
The newer side of Virginia Beach–Norfolk — the 23.2% of homes built since 2000, concentrated around growing communities like Virginia Beach — runs on matched modern systems that age more gracefully but fail in their own ways: heat pumps and condensers worked hard by 1,822 cooling degree days of hot-season demand, control boards and sensors wearing out in houses that all reach the same age at the same time. One metro, two equipment generations, and the sections below take them in the order this metro's data ranks them.
Over everything sits the weather, and here it is measured rather than described: NOAA's station at NORFOLK NAS, VA US averages 61.4 degrees across the year, with 41.5 days reaching 90 or more and 32.5 nights at freezing or below. A furnace feels that record as a season of relentless cycling; a condenser feels it as a summer without a quiet week; a heat pump feels both. The problem ranking below is what those numbers, crossed with the housing profile, produce for Virginia Beach–Norfolk specifically.
Two public records, one metro: what was built here, and what the sky does to it.
The distribution, in one breath: of every hundred Virginia Beach–Norfolk homes, 18.9 were standing before 1960, 25.8 went up in the two decades after, 32.1 in the two after that, and 23.2 have arrived since 2000. Percentages flatten the picture, so hold the counts beside them — 143,349 oldest-era homes, 175,962 newest — and the metro's heating and cooling stops being an abstraction: it is that many systems, of those ages, failing in that order.
Homes from 1980 to 1999 form Virginia Beach–Norfolk's largest band, and they set its HVAC agenda: ducted systems entering their middle age, first-generation high-efficiency furnaces wearing toward their verdicts, condensers on refrigerant generations now in phase-down, thermostats from the first programmable era. It is a stock past its carefree decades and into its maintenance decades — the era where watched systems keep lasting and unwatched ones start presenting their accounts in the form of breakdowns.
Close behind the leader come the 1960-1979 homes, 25.8% of the stock. Their systems are mid-change by construction — the decades when cooling spread mid-stream — so this band is where a Virginia Beach–Norfolk technician earns the diagnostic fee: airflow readings and pressure tests that say which side of the transition a given house was built on.
The climate column of this profile is a workload statement. 3,106 heating degree days say how long the cold half of the year keeps furnaces and heat pumps working at their hardest; 1,822 cooling degree days say how relentlessly the hot half loads every condenser and coil; 32.5 freezing nights and 41.5 hot days mark the extremes where the failures concentrate. NOAA keeps these figures at NORFOLK NAS, VA US as thirty-year normals — which is to say, as the closest thing HVAC has to a settled forecast.
Hold the two halves together and the rest of this page explains itself: the problems ranked highest here are the ones where Virginia Beach–Norfolk's dominant housing era and its climate record overlap. Change either dataset and the ranking changes — which is precisely why this profile is rebuilt from the records for every metro instead of carried over from the last one.
Listed in the order this metro's housing and climate data supports.
Warm air from the vents is a symptom with several authors — capacitor, charge, airflow, controls — and AC repair in Virginia Beach–Norfolk separates them by measurement at your unit, not by parts swapped on hope.
One more pattern belongs in the Virginia Beach–Norfolk picture: repair calls here are also a refrigerant story. Systems fitted in the older decades run on refrigerant generations the industry has been retiring, and every repair on those units weighs the charge's scarcity against the system's remaining life. The technician who explains that arithmetic plainly — what the repair restores, what it cannot assure anyone about next summer — is giving the household the real choice, and in the 339,031 pre-1980 homes it is a conversation held weekly. In Virginia Beach–Norfolk that holds across 128 ZIP codes, from Virginia Beach out to Norfolk.
Count the exposure from the Census side: a median build year of 1983 across 758,459 housing units means half the metro's air conditioners are older than the systems in the growth suburbs around Chesapeake, and summer runtime is the statistic that matters — the repair calls follow it street by street.
In Virginia Beach–Norfolk this service is booked most often through the problem patterns at the top of this page — the metro's housing data, not habit, sets the order. If your home is in the 44.7% built before 1980, mention its age on the call: it changes the parts the technician loads before heading to Virginia Beach and the rest of the metro.
Three parts, one system: filtration captures what the air carries, humidity control keeps moisture where the building tolerates it, and ventilation replaces stale air on schedule. Equipment chosen for one part cannot do the others' work.
The air quality conversation in Virginia Beach–Norfolk starts with humidity more often than with gadgets. A home whose summer indoor humidity rides high grows musty at the coil and uncomfortable at the thermostat, and a home dried out by 3,106 heating degree days of winter runtime irritates skin, wood and sinuses in the opposite direction. The assessment measures before it prescribes: humidity in both seasons, the filter's actual condition and fit, the duct leakage that pulls attic or crawl-space air into the supply stream in the metro's older districts. Locally the workload concentrates where the stock is oldest — the districts built around the 1980s first.
Air quality demand in this metro is written by its sealed seasons: 41.5 hot days with the windows shut around the cooling, 32.5 freezing nights with them shut around the heat. The 175,962 post-2000 homes hold their air tightest; the older districts around Newport News exchange theirs with attics and crawl spaces.
Where this service gets booked in Virginia Beach–Norfolk follows the map on this page: the older districts generate the deep-end work, the post-2000 subdivisions the wear-and-tear work, and the 243,465 homes in between split the difference. Telling the call center your home's build decade — most Virginia Beach–Norfolk owners know it within a few years — puts the right kit on the van the first time.
The evidence lives in the returns. Matted dust, debris from construction, hair woven into the load: that is the case for cleaning, made by the ductwork itself. A light film in a tidy system is the case for waiting, and an honest visit says so.
What comes out of a Virginia Beach–Norfolk duct system tells the home's biography: drywall dust from the renovation, pet hair in proportion to the household, the fine grit that 45.68 inches of yearly rain and the dry seasons between them work into every return. Cleaning matters most where the biography is long — the pre-1980 homes, 44.7% of the stock — and where a household's breathing argues for it. A technician who shows the before and after, and says plainly when a system does not need the work, is the one whose advice holds up. Ask in Newport News and the answer rhymes with Virginia Beach: same eras, same equipment generations, same calendar of failures.
Duct demand concentrates in the metro's long-biography homes: 339,031 pre-1980 systems that have carried decades of household air, and the renovated homes around Portsmouth (97,299 residents) whose construction dust is still in the runs.
One local habit worth copying: Virginia Beach–Norfolk homeowners who mention their street's building era when they book get a better-matched visit, because a technician heading to a the 1980s home in Camden County loads different parts than one heading to a new-build subdivision in Chesapeake. The service is the same; the preparation is local.
Maintenance is a partnership with a division of labor: the household changes filters and keeps the outdoor unit clear; the professional brings instruments, the checklist and the judgment to read what the measurements are saying.
Ask what a tune-up prevents in Virginia Beach–Norfolk and the answer is the peak-season failure: the capacitor that gives out on the first 100-degree afternoon, the condensate switch that floods a closet in the humid weeks, the igniter that chooses the coldest night of January. Those parts announce themselves in advance to anyone measuring — weakening values, slow drains, dirty flame sensors — and the maintenance visit exists to hear the announcements in spring and autumn instead of in the emergency weeks. The NORFOLK NAS, VA US record — 3,106 heating degree days, 1,822 cooling — is the backdrop Camden County technicians plan around.
The maintenance caseload is the installed base itself: 758,459 housing units whose systems each face 41.5 hot days and 32.5 freezing nights a year. Around Williamsburg (15,564 residents) as in the old core, the twice-yearly visit is what stands between that calendar and the emergency diary.
Where this service gets booked in Virginia Beach–Norfolk follows the map on this page: the older districts generate the deep-end work, the post-2000 subdivisions the wear-and-tear work, and the 243,465 homes in between split the difference. Telling the call center your home's build decade — most Virginia Beach–Norfolk owners know it within a few years — puts the right kit on the van the first time.
In Virginia Beach–Norfolk, the drip from an indoor unit is a drainage story — a clogged line, a failed pump, a route without fall — and it is corrected at the drain path, not wiped up and watched.
Mini-splits also answer a Virginia Beach–Norfolk housing pattern the census tables only hint at: the multigenerational home, the converted space, the workshop that became an office. Across 701,116 households, the rooms that need conditioning keep multiplying faster than duct systems can follow, and a ductless head follows in an afternoon's installation where a duct extension would take a renovation. The assessment stays the same — the space, its exposure, its use — but the question it answers is as much about how the household lives as how the house was built. The 45.68 inches of rain in an average year here is part of the story too — humidity loads every cooling coil in the metro.
Scale the question by the Census count and it stays concrete: 758,459 housing units, a share of them holding rooms — additions, conversions, finished spaces — that no duct serves. The mini-split visit exists to give one of those rooms its own climate, sized to its exposure and use.
Where this service gets booked in Virginia Beach–Norfolk follows the map on this page: the older districts generate the deep-end work, the post-2000 subdivisions the wear-and-tear work, and the 243,465 homes in between split the difference. Telling the call center your home's build decade — most Virginia Beach–Norfolk owners know it within a few years — puts the right kit on the van the first time.
From Virginia Beach to Newport News, Virginia Beach–Norfolk replacements routed through TempReach USA end in commissioning — measured charge and airflow — so the installed system matches the calculated one.
From Virginia Beach to Newport News, a no-heat call through TempReach USA reaches a local professional whose visit includes the exchanger and venting checks that furnace work owes a Virginia Beach–Norfolk household.
With 758,459 homes and a median build year of 1983, Virginia Beach–Norfolk heating stock spans every era of furnace and flue — each installation assessed on its own house, not on the outgoing unit's label.
From Virginia Beach to Newport News, Virginia Beach–Norfolk heat pump calls through TempReach USA reach a local professional who explains findings plainly and quotes after assessing — in the heating season and the cooling season alike.
Across Camden, Currituck, Gates, Gloucester, Isle of Wight, James City, Mathews, Surry, York, Chesapeake city, Hampton city, Newport News city, Norfolk city, Poquoson city, Portsmouth city, Suffolk city, Virginia Beach city, Williamsburg city, one climate fact shapes the configuration: 3,106 heating degree days against 1,822 cooling degree days tells whether the control's year is mostly a heating story, mostly a cooling story, or a genuine heat pump balancing act.
Across Camden, Currituck, Gates, Gloucester, Isle of Wight, James City, Mathews, Surry, York, Chesapeake city, Hampton city, Newport News city, Norfolk city, Poquoson city, Portsmouth city, Suffolk city, Virginia Beach city, Williamsburg city, the local professional who answers knows the stock — a median build year of 1983 across 758,459 homes means systems of every age failing in their characteristic ways, from Virginia Beach to the metro's newest subdivisions.
Virginia Beach–Norfolk's commercial buildings span every era around a median build year of 1983 — and with the era goes the equipment, from aging single units over old storefronts to multi-zone systems in new developments, all serviced from a per-unit record.
If this page's services were ranked by Virginia Beach–Norfolk's call patterns rather than listed in catalogue order, they would come out much as they do here — because the ranking behind them is data, not habit. The refrigerant transition reaching older systems leads the metro's problem table and humidity burden on homes and cooling systems follows, so the services answering them lead the list. The long tail of a metro's HVAC life — thermostat calls, duct questions, the one room that never matches the rest — fills in the diary around them, here as everywhere.
Chosen by this metro's own housing and weather data — the same two records this whole page is built from.
The transition is, at bottom, a story about what is inside the pipes. A cooling system is not a generic appliance; it is built around a specific refrigerant, with a compressor, metering device and oils chosen for that chemistry, and the generations do not interchange. In Virginia Beach–Norfolk all the generations are in service simultaneously — R-22 veterans in the older districts, R-410A systems across the middle decades, the newest refrigerant generation arriving in current installations — and a technician's van effectively serves three eras of the same trade at once. The homeowner's part in the story is knowledge of a single fact: which generation is in the backyard. That fact, readable from the nameplate, decides the economics of every leak, every charge and every major component from now on, and it is the first thing a good service conversation establishes.
Judge a refrigerant-era system by its leak history and its trend, not by a single charge reading. One low reading after many tight years is an event; a pattern of small losses is a biography, and the biography is what the economics should be based on. Virginia Beach–Norfolk's climate record loads the question at both ends — a leaking system underperforms exactly when NORFOLK NAS, VA US's 41.5 hot days demand its full capacity, and its owner pays for refrigerant and lost performance simultaneously. The households that navigate this transition well keep one habit: they can state their system's age, refrigerant and last three repairs without looking them up. That small command of the facts converts an industry-wide generational change into a single household's managed decision, which is the scale at which it was always going to be decided anyway.
Count the generations the way a technician's route does: a single Virginia Beach–Norfolk street can hold an R-22 veteran, two R-410A systems and a current-generation installation within a few doors. The service records of one metro contain the whole transition — which is why identification, not assumption, opens every diagnosis here.
Ask where a home's humidity actually comes from and the answers are a census of ordinary life: showers, cooking, laundry, breathing, houseplants, a damp crawl space exhaling through the floor, rain finding the grade against the foundation. In Virginia Beach–Norfolk the outdoor air itself joins the census for much of the year, entering through every leak in the envelope and every return-duct path that crosses a humid space. The air conditioner is expected to process the sum of it. That expectation is reasonable only when the system's drying capacity is matched to the load — and the load is a property of the house and its climate together, which is why two identical systems on the same street can leave one house crisp and another sticky: the houses are importing different amounts of water, and only one system's setup accounts for it.
The physics of the burden are worth stating plainly. Air holds water as vapor; the amount it can hold rises with temperature, which is why warm air arriving in a Virginia Beach–Norfolk summer carries so much of it indoors. A cooling coil removes moisture by passing air across a surface cold enough for water to condense on it — the same physics that beads a cold glass. Two conditions govern how much condenses: how long the air stays against the cold coil, and how cold the coil runs. Short cycles starve the first; high airflow can starve the second. Meanwhile the house keeps adding vapor from living and from its own damp places, and the envelope keeps trading air with the outdoors. Indoor humidity is the running balance of that account — removal by the coil against addition by everything else — and a house that feels damp is simply a house whose account is out of balance in the wet direction.
Count the load the way the coil experiences it: through the humid months, each pass of indoor air delivers moisture that must condense and drain before the air can feel finished. In Virginia Beach–Norfolk, where cooling degree days reach 1,822 a year, that invisible water work rivals the temperature work the system was named for.
The rooms tell the story before any instrument does. In a Virginia Beach–Norfolk home with tired ductwork, the pattern is geographic: the rooms nearest the air handler are comfortable, the far rooms lag, and the rooms over the longest or leakiest runs barely participate. Households adapt without noticing — a fan in the far bedroom, a space heater in the end office — treating as architecture what is actually plumbing for air. Duct runs installed in the metro's big building decades have now spent years in attic heat and crawl-space damp; flex sections sag, inner liners tear, and connections at the plenum work loose a fraction with every season's expansion and contraction. The equipment cycles faithfully and the house still under-delivers, because a system can only condition the air that actually arrives.
Read a duct system the way a technician does and the examination has a shape: start at the air handler and work outward. At the plenum, connections are inspected where they are most stressed and most consequential. Along the runs, the checks are for the known failure family — separated joints, fallen insulation, sagging flex, crushed sections, takeoffs that were sealed with hope rather than mastic. At the registers, temperatures and airflow are compared room by room, and the map of strong and weak rooms is laid over the map of the runs themselves; the two maps explain each other with remarkable consistency. Returns get the same walk, with attention to panned cavities and any path that lets the system breathe from outside the envelope. Cleaning belongs in this picture where the inspection finds accumulation — but cleaning a leaking network without sealing it polishes the inside of a system that is losing its cargo through the walls.
Consider the delivery assumption: every system in Virginia Beach–Norfolk was sized on the expectation that its air would arrive. With 44.7% of homes built before 1980 — and their networks renovated, extended and re-sealed by turns ever since — that expectation's reliability varies house by house, which is why the measurement, not the assumption, has to govern.
The oldest systems in Virginia Beach–Norfolk carry one more complication: their supporting cast is old too. Ductwork sized for an earlier furnace, refrigerant lines run for a refrigerant generation that has since been phased down, thermostats wired before communicating controls existed, electrical panels with no spare capacity for a modern system's starting load. Ageing, in an older home, is a property of the whole installation rather than a single appliance. That is why the honest maintenance conversation in an the 1980s home ranges wider than the nameplate: the machine, its air path, its refrigerant generation and its controls are ageing on four clocks at once, and the visit that checks all four is the one that predicts the year rather than reacting to it.
A serious look at an ageing system follows a short order. First, identity: the nameplate's age, model and refrigerant, because those three facts set the realistic horizon. Second, the electrical profile: starting components, motor draws, the condition of connections and the disconnect. Third, the air side: filter, coil cleanliness, blower condition and the temperatures across the system, which together say whether the machine is moving its rated air. Fourth, the combustion side on heating equipment: ignition condition, flame quality, exchanger inspection and venting. Last, the conversation those readings support — what is sound, what is spent, what to watch, and what the household should plan for in which season. In Virginia Beach–Norfolk's older housing that order matters more, not less, because the findings compound: an old system behind dirty coils and a drifting charge is three small problems impersonating one large one.
Look at the replacement echoes: the 175,962 homes built since 2000 are now carrying first-generation equipment deep into its service life, joining the older cohorts. In Virginia Beach–Norfolk, ageing is not a niche condition of old houses; it is the metro's standard equipment profile.
One thermostat, one system, and a house that cannot agree on the temperature: the upstairs bakes while the downstairs needs a sweater, the addition never matches the original rooms, the far bedrooms run their own climate entirely. In Virginia Beach–Norfolk this is among the most common comfort complaints in larger and multi-storey homes, and among the most misdiagnosed, because the equipment is usually innocent. A single system delivers air according to its duct network's design and its thermostat's location — and the thermostat only reports its own room. Floors gain heat differently, sun loads rooms differently by the hour, and duct runs deliver unevenly by length and condition, so the house's rooms drift apart while the system reports success at the one point it measures. The answers live at three levels: airflow correction in the existing network, zoning that lets one system serve areas on separate calls, and ductless equipment that gives the problem rooms their own dedicated capacity. Which level fits depends on how far apart the rooms are, and why — a diagnosis question before it is an equipment question.
Judge a multi-room home at its extremes, not at its thermostat. The thermostat sits, by convention, in the home's most average room, and it will report contentment while the nursery roasts and the end office freezes. The extremes are the system's true report card, and in Virginia Beach–Norfolk they follow the climate record honestly: 41.5 hot days audit the upstairs, 32.5 freezing nights audit the far rooms over unheated spaces, and the household learns its home's real climate map from the rooms it avoids in each season. Homes whose extremes are comfortable have been sorted — by design, by correction or by dedicated equipment — and homes whose extremes are endured are carrying an unsorted map. The sorting is a solvable problem in essentially every case; what it cannot survive is being mistaken for an equipment failure and treated with a bigger version of the same single answer.
The climate record sets the pattern's stakes in Virginia Beach–Norfolk: 1,822 cooling degree days load the upper floors through the summer while 3,106 heating degree days expose the far rooms all winter. A house with an unsorted delivery map is audited at both ends of the year — the pattern is not seasonal, it is structural, and the seasons merely take turns proving it.
Twice a year, Virginia Beach–Norfolk changes its mind. The shoulder seasons — the weeks when a house can need heating in the morning and cooling by afternoon, sometimes within the same day — ask more of a system and its household than either deep season does: both modes in working order at once, controls set for change rather than for a settled pattern, and equipment that may sit idle for stretches and then be called on without ceremony. The record at NORFOLK NAS, VA US frames the workload honestly — 3,106 heating degree days against 1,822 cooling degree days, a genuinely two-season climate — and the shoulders are where the two halves meet and negotiate. The checks that matter are changeover checks: the season just ending reviewed for what it spent — the filter, the wear items, the symptoms it filed — and the season arriving proven before it is needed, with a full run in the new mode while the weather is still forgiving. The thermostat's program belongs in the same check; last season's schedule, carried forward unexamined, is how a house ends up heating against an open-window afternoon. Households that treat the shoulders as their maintenance seasons get two calm, well-timed looks at their system a year — which is exactly the rhythm the equipment's manufacturers had in mind.
The season loads Virginia Beach–Norfolk's systems the way its record at NORFOLK NAS, VA US says it will: 3,106 heating degree days against 1,822 cooling degree days in an average year, against a housing stock whose median build year is 1983. The households that read the season early — filters, drains, a system run before the extreme weeks — are the ones whose calls stay schedulable.
In Virginia Beach–Norfolk the transition's map is the housing map, lagged by one equipment generation. The districts built around Virginia Beach and the the 1980s streets hold the metro's R-22 veterans, in homes that have already seen one full cycle of this story when the equipment before them was young. The middle suburbs hold the R-410A majority. The 175,962 homes built since 2000 carry early current-generation systems now reaching the age where their first major repairs will be quoted — into a market whose standard has already moved on again. Read as a whole, the metro's 758,459 housing units contain the refrigerant industry's last several decades standing in rows, and the service economy of the metro is, in part, the business of keeping all those decades running at once. The deep pattern for a homeowner is simple to state and slow to change: your system's generation is a property of your street's building era, and its implications were installed with the house.
Read the ranking backwards and it reads as a data summary: 1,782,590 residents in 758,459 housing units, 18.9% of the housing from before 1960, 45.68 inches of rain in an average year. The pattern leads because the exposure is broad — counted not in individual unlucky houses but in whole eras of the metro's building, stacked one on another.
The first visit follows a short, diagnostic list — each item ruling a branch of the problem in or out:
PROBLEM SOLUTION
Population 457,066
Population 251,153
Population 235,037
Population 184,774
Population 137,334
Population 97,299
Population 96,638
Population 15,564
Population 12,556
Population 11,159
Population 8,729
Population 7,903
Also in the Virginia Beach–Norfolk metro: Moyock (population 5,669), Bethel Manor (population 4,512).
The communities in the grid are not suburbs of the page; they are its subject as much as Virginia Beach is. Chesapeake (251,153 residents) and Norfolk (235,037) carry their own building decades, their own equipment generations and their own positions in the problem ranking's logic — a system under a Chesapeake roof answers to the same data as one in the centre, but to a different era of it. Coverage here is defined by the ZIP list below; understanding is defined street by street, and this page's figures are the metro-wide version of a story each community tells in its own numbers.
Beyond the largest communities sit Newport News (184,774), Hampton (137,334), Portsmouth (97,299), Suffolk (96,638), Williamsburg (15,564) — smaller places across Camden, Currituck, Gates, Gloucester, Isle of Wight, James City, Mathews, Surry, York, Chesapeake city, Hampton city, Newport News city, Norfolk city, Poquoson city, Portsmouth city, Suffolk city, Virginia Beach city, Williamsburg city, covered on the same terms. Their housing tends to be older on average than the big suburbs', and their calls follow the older patterns on this page. One routing covers them all: find your ZIP code below and the rest is a phone call.
Start with Virginia Beach itself: 457,066 residents, 25.6% of the metro — the centre the rest of the map orbits. Chesapeake (251,153) and Norfolk (235,037) form the next ring out, housing with its own building decades and its own equipment generations. Beyond them the metro thins into the smaller communities in the grid above, each a few thousand households deep — small in population, identical in one respect: their systems answer to the same eras and the same weather as the big city's.
The metro answers to 18 county governments (Camden, Currituck, Gates, Gloucester, Isle of Wight, James City, Mathews, Surry, York, Chesapeake city, Hampton city, Newport News city, Norfolk city, Poquoson city, Portsmouth city, Suffolk city, Virginia Beach city, Williamsburg city), a patchwork that matters at permit time rather than at the thermostat. Camden County carries the centre; the others carry the growth rings and the older outlying towns. A technician routed through this page works inside that patchwork daily — the weather does not care about the boundaries, but the job's paperwork does.
This page ends at the metro boundary, but the region does not: Richmond, VA, Charlottesville, VA and Lynchburg, VA continue the coverage in their own directions, each with a profile built from its own Census and NOAA figures. If your home sits near the line between metros, go by your ZIP code — it places you in the dataset that describes your housing.
Set Virginia Beach–Norfolk among its neighbours and the contrasts sharpen the profile: Richmond, VA — metro population 1,389,338, median build year 1984 — sits 63 miles away; Charlottesville, VA (228,597, median 1988) 136 miles; Lynchburg, VA (269,169, median 1980) 153 miles. Three different housing stocks under three nearby skies, which is why each keeps its own page and its own problem ranking rather than borrowing this one.
Ratios tell the metro's story compactly. Renters occupy 36.9% of homes; owners hold the rest. For every home built since 2000 there are 1.9 from before 1980. Spread the stock across the coverage map and each ZIP code carries about 5,925 housing units — the density at which era patterns repeat street after street instead of scattering, and at which a routed round of calls stays inside a few districts.
One line of Virginia Beach–Norfolk arithmetic — a median home 43 years old · 442,404 owner-occupied homes against 258,712 renter-occupied · 1,120 pre-1960 homes for every covered ZIP code · a heating-to-cooling degree-day ratio of 1.7 · 1,160 mm of rain in an average year.
County pages carry the local detail — land area, climate normals and the heating and cooling pressures on the ground in each county.
More plain-language help: the TempReach USA heating & cooling guides
One call connects you with an independent local heating and cooling professional serving Virginia Beach–Norfolk and the surrounding metro.
Call center hours: Mon-Fri 7:00 AM-10:00 PM ET | Sat 8:00 AM-10:00 PM ET | Sun 7:00 AM-9:00 PM ET