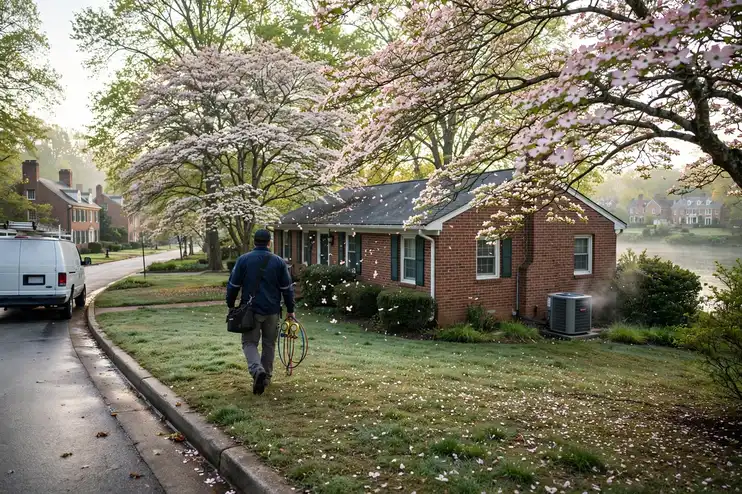


This is Richmond's heating and cooling page, built from Richmond's own numbers: Census housing figures, the metro's ZIP codes and its NOAA climate record. TempReach USA routes your call to an independent local HVAC technician; the homework below is here so you know your home's likely problems before you ever make it.
Call center hours: Mon-Fri 7:00 AM-10:00 PM ET | Sat 8:00 AM-10:00 PM ET | Sun 7:00 AM-9:00 PM ET
The median Richmond home was built in 1984; 44.6% of the stock predates 1980, and the pattern this metro's own data ranks first is the refrigerant transition reaching older systems. TempReach USA is a referral service, not an HVAC company: one call connects you with an independent local HVAC technician serving your ZIP code.
Two numbers frame everything that follows: 67.1% of Richmond homes are owner-occupied, and the median one was built in 1984. Ownership matters to HVAC because owners inherit their systems whole — every equipment decision a builder made in the 1980s or earlier is still in the attic, the closet and the side yard, ageing on its original schedule. With 44.6% of homes predating 1980 and 25.8% arriving since 2000, the metro is really two housing stocks sharing one map, and they are taken separately below before the problems are ranked.
Stand in one of Richmond's older neighbourhoods and you are standing in its HVAC's back catalogue. The homes there — part of the 250,359 built before 1980 across this metro — went up when a furnace was built to serve for a generation and central cooling was still spreading street by street. That generation has now elapsed several times over. What it leaves behind is not universal failure but universal exposure: every duct joint, igniter and condenser coil in those districts is operating past the horizon its makers planned for, in Amelia County and beyond, and the failures arrive in the order the parts tire.
Growth wrote this metro's newest HVAC chapter in matched equipment and planned ducts: systems sized as a single design, controls by the catalogue, outdoor units placed by the plat across the subdivisions near Tuckahoe and Mechanicsville. The chapter is young — its systems have decades in hand — but it is not exempt from the metro's arithmetic: 1,560 cooling degree days of demand work its condensers hard, and the winters test its heat pumps with the same cold that tests the oldest furnace in Amelia County.
The weather's part in this is written at RICHMOND INTL AP, VA US, where an average year carries 45.5 inches of precipitation, 44.9 days at ninety degrees or more and 73.5 nights at freezing or below. Systems experience that year as workload and as stakes in roughly equal measure — the workload in the run hours, the stakes on the single coldest night and the single hottest week. The problem ranking further down is simply the housing profile above, read under this sky.
The metro's building eras on one side, its weather record on the other — and its heating and cooling where the two meet.
Break the stock down by building era and the profile sharpens. Before 1960: 21.5% of homes, roughly 120,689 of them. From 1960 to 1979: 23.1%, about 129,670. From 1980 to 1999: 29.6%, about 166,158. Since 2000: 25.8%, about 144,826. Four eras, four equipment generations — and the balance among them is this metro's HVAC character in a single paragraph.
This metro's stock was mostly built in HVAC's transitional decades, 1980 to 1999, and it shows a particular failure calendar: not the deep-design sagas of the old metros, but the wear-out wave of everything installed in those years arriving together — capacitors, igniters, control boards, the first of the modern systems ageing into their verdicts. Richmond's HVAC story for the next decade is largely written: it is the story of that installed base reaching its limits neighbourhood by neighbourhood.
The second-largest band is the newest: 144,826 homes built since 2000, 25.8% of the metro. Young stock writes young HVAC — condenser waves, control waves, the first heat pump questions — arriving street by street as uniform subdivisions age in lockstep around Tuckahoe and the growth edge. It is the metro's future workload, visible early to anyone reading the table.
The climate half of the profile, from RICHMOND INTL AP, VA US: 3,736 heating degree days against 1,560 cooling degree days, 45.5 inches of precipitation, an average temperature of 59.0 degrees. Read together, those figures describe the loads: how many hours a furnace runs in a year, how relentlessly a condenser cycles through summer, how much moisture the cooling coil must pull from the air — 73.5 nights at or below freezing, against 44.9 days at 90 or above.
That is the whole method of this page in one section: era shares from the Census, loads from NOAA, and a problem list that is simply where the two overlap most in Richmond. The services and guidance that follow are ordered by the same profile — local first, generic last.
Sequenced by this metro's own problem ranking, not by a national catalogue order.
The local professional you are connected with reads the system the way it fails: electrical values first, then temperatures and pressures, then airflow, until one finding explains all of the symptoms at once.
Cooling failure in Richmond is rarely random. It bunches on the first serious heat wave, again in the late-summer grind, and it concentrates where the equipment is oldest — the pre-1980 districts, 44.6% of the metro's housing — and where the newest subdivisions' identical units reach the same wear points in the same seasons. The technician who works these streets stocks the van for both patterns: the ageing system's slow decline and the young fleet's shared failures. Ask in Petersburg and the answer rhymes with Richmond: same eras, same equipment generations, same calendar of failures.
The local caseload behind this service is written in the climate figures: 1,560 cooling degree days a year and 44.9 days at 90 or above, pressing on a cooling fleet whose oldest members serve the 250,359 pre-1980 homes — in Tuckahoe (48,610 residents) as much as in the oldest districts.
Where this service gets booked in Richmond follows the map on this page: the older districts generate the deep-end work, the post-2000 subdivisions the wear-and-tear work, and the 166,158 homes in between split the difference. Telling the call center your home's build decade — most Richmond owners know it within a few years — puts the right kit on the van the first time.
Tight houses need deliberate breathing. A ventilator exchanges stale air for fresh while recovering energy between the streams — the managed version of what leaky construction used to do by accident, with filtration on the intake.
The air quality conversation in Richmond starts with humidity more often than with gadgets. A home whose summer indoor humidity rides high grows musty at the coil and uncomfortable at the thermostat, and a home dried out by 3,736 heating degree days of winter runtime irritates skin, wood and sinuses in the opposite direction. The assessment measures before it prescribes: humidity in both seasons, the filter's actual condition and fit, the duct leakage that pulls attic or crawl-space air into the supply stream in the metro's older districts. With a median build year of 1984, most of the metro's 561,343 housing units are working through the same ageing curve.
The local figures behind the service: 523,778 households, indoor humidity driven by 45.5 inches of yearly rain and long humid stretches, pollen seasons that load every return in Amelia County. The assessment measures a home against exactly that climate, not against a generic standard.
One local habit worth copying: Richmond homeowners who mention their street's building era when they book get a better-matched visit, because a technician heading to a the 1980s home in Amelia County loads different parts than one heading to a new-build subdivision in Tuckahoe. The service is the same; the preparation is local.
Method separates cleaning from stirring. Negative pressure on the whole network, agitation in every run, registers off and washed, the blower compartment cleared — anything less moves the dust from one room's duct to another's.
A word on timing, since Richmond households ask: duct cleaning earns its appointment when the evidence calls for it — after construction or renovation dust, when a home changes hands after years of one household's accumulation, when the registers show visible load or the blower compartment tells the story. Booked on evidence, it is honest work with visible results. Booked on a calendar superstition, it is a van ride. Local technicians who work from the evidence are the ones this page's routing favours, in Richmond and across the metro alike. Locally the workload concentrates where the stock is oldest — the districts built around the 1980s first.
Count the systems and the diary fills itself: 523,778 households breathing through ductwork daily, the oldest of it in homes from the 1980s and the newest in the subdivisions past Chester. What the cleaning finds follows the biography — dust in proportion to years, debris in proportion to renovations.
In Richmond this service is booked most often through the problem patterns at the top of this page — the metro's housing data, not habit, sets the order. If your home is in the 44.6% built before 1980, mention its age on the call: it changes the parts the technician loads before heading to Richmond and the rest of the metro.
The condition report is the product that outlasts the visit. Specific measurements, watch items named, urgency ranked — and next year's visit comparing against this year's numbers, so drift becomes visible before it becomes failure.
The tune-up diary in Richmond follows the installed base: the pre-1980 districts' ageing systems, kept in service by attention; the middle ring's equipment in its second decade, where maintenance decides whether it sees a third; the subdivisions' matched fleets, all reaching the same service points in the same seasons. A maintenance visit is measurement more than ritual — temperatures, pressures, electrical readings, airflow — recorded against last year's figures, so the system's direction is known rather than guessed. The 45.5 inches of rain in an average year here is part of the story too — humidity loads every cooling coil in the metro.
Tune-up demand follows the fleet's waves: the subdivisions' matched systems reaching service points together, the pre-1980 districts' individual units on individual schedules. Meadowbrook sits inside one of those patterns; the readings taken there this season predict its systems' next one.
Where this service gets booked in Richmond follows the map on this page: the older districts generate the deep-end work, the post-2000 subdivisions the wear-and-tear work, and the 166,158 homes in between split the difference. Telling the call center your home's build decade — most Richmond owners know it within a few years — puts the right kit on the van the first time.
Ductless comfort in Richmond is designed room by room: a unit sized from the room's own load modulates quietly and evenly, while one guessed at short-cycles or strains, zone by zone.
The mini-split question in Richmond is usually a room that the main system cannot reach or cannot satisfy — the upstairs bedroom under a hot roof, the addition beyond the duct run, the converted garage in Mechanicsville. The technology answers with zones: one outdoor unit, one or more indoor heads, each room on its own setting. Sizing still rules the outcome; an oversized head short-cycles and leaves the humidity behind, and Richmond's humid stretches punish that error daily. That is the daily reality for the 523,778 households spread across Amelia, Charles City, Chesterfield, Dinwiddie, Goochland, Hanover, Henrico, King and Queen, King William, New Kent, Powhatan, Prince George, Sussex, Colonial Heights city, Hopewell city, Petersburg city, Richmond city.
The search territory for ductless is the metro's unducted stock: 120,689 pre-1960 homes built before central systems, plus the additions and conversions scattered through 523,778 households — in Colonial Heights and the historic core alike, spaces the main system never reached.
Where this service gets booked in Richmond follows the map on this page: the older districts generate the deep-end work, the post-2000 subdivisions the wear-and-tear work, and the 166,158 homes in between split the difference. Telling the call center your home's build decade — most Richmond owners know it within a few years — puts the right kit on the van the first time.
Replacement in Richmond begins with a load calculation across Amelia, Charles City, Chesterfield, Dinwiddie, Goochland, Hanover, Henrico, King and Queen, King William, New Kent, Powhatan, Prince George, Sussex, Colonial Heights city, Hopewell city, Petersburg city, Richmond city: the independent local professional measures the home — not the old unit's label — and quotes the full scope before work begins.
Furnace repair in Richmond follows the sequence: the independent local professional covering Amelia, Charles City, Chesterfield, Dinwiddie, Goochland, Hanover, Henrico, King and Queen, King William, New Kent, Powhatan, Prince George, Sussex, Colonial Heights city, Hopewell city, Petersburg city, Richmond city watches your furnace attempt a start, tests the stage that failed, and quotes before work begins.
With 561,343 homes and a median build year of 1984, Richmond heating stock spans every era of furnace and flue — each installation assessed on its own house, not on the outgoing unit's label.
From Richmond to Petersburg, Richmond heat pump calls through TempReach USA reach a local professional who explains findings plainly and quotes after assessing — in the heating season and the cooling season alike.
Across Amelia, Charles City, Chesterfield, Dinwiddie, Goochland, Hanover, Henrico, King and Queen, King William, New Kent, Powhatan, Prince George, Sussex, Colonial Heights city, Hopewell city, Petersburg city, Richmond city, one climate fact shapes the configuration: 3,736 heating degree days against 1,560 cooling degree days tells whether the control's year is mostly a heating story, mostly a cooling story, or a genuine heat pump balancing act.
In Richmond, emergency means weather-relative: 3,736 heating degree days put no-heat calls on a freezing clock each winter, while 1,560 cooling degree days make a dead system a health question each summer — the call center triages against both, using the hours shown on this page.
Across Amelia, Charles City, Chesterfield, Dinwiddie, Goochland, Hanover, Henrico, King and Queen, King William, New Kent, Powhatan, Prince George, Sussex, Colonial Heights city, Hopewell city, Petersburg city, Richmond city, one climate ledger drives the calendar: 3,736 heating degree days and 1,560 cooling degree days mean roof units work both seasons hard, so the spring and fall visits each carry a full checklist here.
Two patterns generate most of the bookings behind the services above: The refrigerant transition reaching older systems and humidity burden on homes and cooling systems. That is why the order of this page's service list is what it is — the services answering those patterns come early, and the rest follow in the order the metro's data supports. A homeowner whose home matches the local profile — built in the metro's big decades, in one of its older districts — is, statistically, reading their own shortlist.
Chosen by this metro's own housing and weather data — the same two records this whole page is built from.
The transition is, at bottom, a story about what is inside the pipes. A cooling system is not a generic appliance; it is built around a specific refrigerant, with a compressor, metering device and oils chosen for that chemistry, and the generations do not interchange. In Richmond all the generations are in service simultaneously — R-22 veterans in the older districts, R-410A systems across the middle decades, the newest refrigerant generation arriving in current installations — and a technician's van effectively serves three eras of the same trade at once. The homeowner's part in the story is knowledge of a single fact: which generation is in the backyard. That fact, readable from the nameplate, decides the economics of every leak, every charge and every major component from now on, and it is the first thing a good service conversation establishes.
A transition-aware service visit has a recognizable order. First, identification: the nameplate's refrigerant, model and year, stated aloud so the household and technician share the fact. Second, the leak question, taken seriously — a system low on charge has a leak until proven otherwise, and recharging without finding it is buying the same refrigerant twice on an installment plan. Third, the condition audit around the failure: compressor health, coil condition, electrical wear, because the decision the household faces is about the whole machine, not the one part that stopped. Fourth, the comparison itself, presented as what it is — the repair path with its realistic horizon, the replacement path with its — so the choice is made on the machine's merits and the household's plans for the home. In Richmond that conversation, held in a calm season, is unhurried and genuinely optional-feeling; held in a heat wave, the same facts arrive wearing a deadline.
The climate loads the stakes: a leaking system in Richmond underperforms through 44.9 days a year at 90 degrees or more at RICHMOND INTL AP, VA US, so the household pays the transition's toll twice — in refrigerant and in lost cooling — until the underlying decision is made.
Cooling and drying are two jobs wearing one name, and in Richmond the second job is the heavier one for much of the season. The climate record at RICHMOND INTL AP, VA US pairs the heat with 45.5 inches of precipitation in an average year, and the air that comes with that moisture asks every air conditioner to do double duty: lower the temperature and wring out the water. A system dries air only while it runs, and only when its coil is cold and its airflow is right — so a unit that satisfies the thermostat quickly and shuts off can leave a house cool and clammy at the same time. The burden shows in the house as much as in the equipment: rooms that feel sticky at a normal setting, a musty note in closets and low corners, condensation on registers and windows, and indoor air that never quite feels finished. Households often answer by turning the thermostat down, which buys dryness with overcooling and longer bills of runtime. The underlying question is a moisture question — where the water is entering, how the system is set up to remove it, and whether the house needs dedicated dehumidification help beyond its cooling cycle.
Judge a home's moisture by its wettest week, not its average one. Averages flatter: in Richmond, an average year at RICHMOND INTL AP, VA US delivers 45.5 inches of rain, but the burden arrives in episodes — the saturated stretch when the ground is wet, the air is wet, and the house's every surface is trading moisture with both. In that week the closet smells, the registers sweat, and the system's drying margin is audited honestly. The homes that pass the audit share a profile rather than a product: sources managed, a system sized and set up to run long enough to dry, a drain that carries the evidence away, and occupants who read indoor humidity the way they read temperature. Moisture problems are patient; they wait for the wet week. The preparation that defeats them is exactly as patient, and considerably cheaper in attention than in consequence.
Count the load the way the coil experiences it: through the humid months, each pass of indoor air delivers moisture that must condense and drain before the air can feel finished. In Richmond, where cooling degree days reach 1,560 a year, that invisible water work rivals the temperature work the system was named for.
Returns deserve as much suspicion as supplies. A leaking supply loses conditioned air; a leaking return recruits unconditioned air — hot attic air in summer, cold crawl-space air in winter, and with it the dust and moisture of whichever space it crossed. In Richmond's older housing, returns are often the rougher half of the network: panned joist spaces, wall cavities pressed into service, connections made to a standard the era allowed. The symptoms point back confusingly — a system that seems to stir dust, rooms that smell of the attic in summer, humidity the air conditioner cannot quite pull down. A duct assessment that only walks the supply side reads half the network. The returns are where the house breathes in, and a home whose returns breathe from its attic will never quite feel the way the equipment's specifications intend.
Households judge their heating and cooling at the thermostat, but the thermostat only reports the room it sits in. Judge the system at its furthest register instead: the air arriving there, its temperature against the supply at the unit, its volume against the room's need. In Richmond that furthest room is the honest auditor of the duct network — it inherits every leak, every sag and every degree of attic heat between it and the air handler. The homes whose far rooms match their near rooms have networks that were sealed when they were built and checked as they aged. The homes whose far rooms lag are not necessarily homes with weak equipment; they are homes whose delivery network has been quietly resigning, joint by joint, while the equipment took the blame and the service calls. The register, not the nameplate, is where the resignation is announced.
The housing numbers frame the exposure: 561,343 housing units in Richmond, a median build year of 1984, and duct networks installed era by era in attics, crawl spaces and wall cavities. Every one of those networks is a set of joints ageing in the dark — the loss pool is the size of the metro itself.
Every heating and cooling system ages, but in Richmond the ageing is concentrated where the housing is. The Census profile behind this page records 44.6% of homes built before 1980 and a median build year of 1984, which means a large share of the metro's furnaces, air conditioners and heat pumps are working in homes that have already outlived one or two generations of equipment — and much of the current generation is itself well into its second decade. Age shows differently than breakdown. An older system loses capacity a little at a time: refrigerant circuits seep at joints that have vibrated for years, blower motors draw more to move the same air, heat exchangers carry scale and rust, and control boards soldier on with components that drift out of tolerance. The household experiences it as a thermostat that needs a lower setting than it used to, rooms that lag, and a system that runs longer to do less. Nothing has failed; everything has faded, and the maintenance question becomes an honest one: what is left in this machine, and what does it need to give it back?
Judge an ageing system by its trend line, never by its kindest day. On its kindest day — mild weather, light load — almost any system in Richmond can still argue for itself. The trend line is written elsewhere: in run times lengthening season over season, in the setting creeping to hold the same comfort, in the rooms that quietly dropped out of the system's reach. RICHMOND INTL AP, VA US's climate record ensures the trend will be tested at both ends of the year — 44.9 hot days and 73.5 freezing nights in an average year. The households that read their trend early choose the terms of the ending, whether that ending is a renewed component, a planned replacement in a shoulder season, or a few more good years bought with honest maintenance. The households that wait for the system's verdict receive it in the weather least suited to hearing it.
Climate presses the point. A system in Richmond works both ends of the year — 3,736 heating degree days against 1,560 cooling degree days at RICHMOND INTL AP, VA US — so its components accumulate in twelve months the wear a single-season climate would spread over two years.
There is a daily rhythm to the complaint that helps diagnose it. Rooms that diverge mostly in the afternoon are reporting solar load and roof heat; rooms that diverge all day are reporting delivery; a house whose floors swap roles between summer and winter — upstairs hot in July, downstairs cold in January — is reporting stack effect and a single system asked to average two buildings' worth of physics. In Richmond all three rhythms run through the housing stock, sorted loosely by plan and era: the two-storey colonials of the growth decades, the sprawling single-level homes whose far wings were always a duct run too far, the renovated houses whose additions rewrote the load map without rewriting the network. Naming the rhythm correctly is most of the work; the remedy, once the name is right, is usually obvious to homeowner and technician alike.
Airflow is the substrate everything else stands on, and its rules are unforgiving. A blower moves a volume of air against the network's resistance; lengthen a run, crush a section, close registers, or clog the path and the volume redistributes itself according to physics, not intention — favoring short, wide, open paths and starving long ones. Balancing is the craft of arranging that redistribution deliberately: damper positions, register adjustment, return paths sized for the supply they serve. In a Richmond home the balance drifts over the years as filters load, furniture rearranges the rooms' air, renovations close paths that used to be open, and duct sections sag or separate. A system can therefore be out of balance without anything being broken — which is both the good news and the diagnostic difficulty, since the remedy is a methodical walk of the whole network rather than a replaced part.
The solar arithmetic testifies daily: on the 44.9 days a year at 90 degrees or more recorded at RICHMOND INTL AP, VA US, a roof-loaded second storey is a measurably hotter building than the floor below it, served by the same machine and judged by the same single thermostat. The divergence is not a malfunction; it is the design being outvoted by physics.
What the shoulders reward is a habit of finishing seasons properly. The last cold week is the time to note the heating system's report card while it is still legible; the last hot week, the cooling system's. Between them sits a window — mild days, an unhurried diary for local technicians, a system that can be opened and tested without the household depending on it that night — that neither deep season gives. In Richmond that window opens twice a year on a climate of 44.9 hot days and 73.5 freezing nights, and the households that use it convert the two most failure-prone transitions of the year into the two calmest appointments on their calendar.
The season loads Richmond's systems the way its record at RICHMOND INTL AP, VA US says it will: 3,736 heating degree days against 1,560 cooling degree days in an average year, against a housing stock whose median build year is 1984. The households that read the season early — filters, drains, a system run before the extreme weeks — are the ones whose calls stay schedulable.
The closer look reveals an irony at the transition's core. The systems most exposed to it — the oldest refrigerant generation — are concentrated in the homes least able to treat replacement casually: Richmond's older housing, whose owners inherited their equipment's generation along with its era's ductwork and electrical service. For those households the repair-versus-replace decision carries more weight per dollar, and the quality of the conversation matters accordingly. Good local practice in this metro recognizes the stakes explicitly: present the leak, the machine's full condition, and both paths with their honest horizons, and let the decision be the household's, made with the nameplate fact on the table. The transition will complete itself across this metro one household decision at a time; the households served well are the ones whose decisions were informed rather than hurried.
The numbers underneath it, for Richmond: 561,343 housing units, a median build year of 1984, and a climate record at RICHMOND INTL AP, VA US of 3,736 heating degree days against 1,560 cooling degree days. Cross the housing record with the weather record and this pattern is what falls out at the top — rarely the most dramatic problem in heating and cooling, but the one this metro's stock and climate manufacture most steadily.
On a first visit for this pattern, a local technician's checks run in a practised order:
PROBLEM SOLUTION
Population 227,595
Population 48,610
Population 38,437
Population 33,365
Population 28,177
Population 23,519
Population 22,944
Population 20,383
Population 18,702
Population 18,210
Population 18,180
Population 17,302
Also in the Richmond metro: Glen Allen (population 16,630), East Highland Park (population 16,071).
Beyond Richmond itself, the metro takes in Tuckahoe (48,610 residents), Mechanicsville (38,437) and the rest of the communities in the grid above — each fitted with heating and cooling in its own building era, which is why two streets in the same metro can need entirely different HVAC conversations. The ZIP list below is the full coverage footprint: if your code is on it, this page was written about your housing stock.
The map continues: Petersburg (33,365), Short Pump (28,177), Chester (23,519), Hopewell (22,944), Meadowbrook (20,383). Different names, different decades — each community in Amelia, Charles City, Chesterfield, Dinwiddie, Goochland, Hanover, Henrico, King and Queen, King William, New Kent, Powhatan, Prince George, Sussex, Colonial Heights city, Hopewell city, Petersburg city, Richmond city was fitted with heating and cooling in its own growth years, which is why two streets in the same metro can need entirely different HVAC conversations. The ZIP list below is the working definition of coverage; the housing behind each code is the working definition of the job.
Richmond (227,595 residents) anchors the metro, and Tuckahoe (48,610) is its second centre of gravity. Between them they hold the bulk of the 523,778 households — and, not coincidentally, the bulk of every housing era this page discusses, from the pre-1960 core to the newest subdivisions. Mechanicsville (38,437) and the communities beyond it repeat the same eras at smaller scale.
Draw the metro by its paperwork and it resolves into Amelia, Charles City, Chesterfield, Dinwiddie, Goochland, Hanover, Henrico, King and Queen, King William, New Kent, Powhatan, Prince George, Sussex, Colonial Heights city, Hopewell city, Petersburg city, Richmond city — 17 jurisdictions sharing one housing stock and one weather system. Amelia County holds the historic centre and the densest share of the older homes; the surrounding counties hold the rings of growth around it. Permits and inspections follow those boundaries even though temperature never does, which is part of why the technician this page connects you to works these streets specifically.
Beyond the metro line, the nearest covered metros are Virginia Beach–Norfolk, VA (63 miles away), Charlottesville, VA (74 miles) and Lynchburg, VA (96 miles) — separate pages, separate profiles, because their housing and weather records are their own. Homeowners near the boundary sit between two datasets; the ZIP list above, not the map's edge, decides which page was written about your stock.
Set Richmond among its neighbours and the contrasts sharpen the profile: Virginia Beach–Norfolk, VA — metro population 1,797,213, median build year 1983 — sits 63 miles away; Charlottesville, VA (228,597, median 1988) 74 miles; Lynchburg, VA (269,169, median 1980) 96 miles. Three different housing stocks under three nearby skies, which is why each keeps its own page and its own problem ranking rather than borrowing this one.
Divide the stock by the map and the densities appear: roughly 5,613 housing units for every covered ZIP code, 30,810 households to a county, 14 named communities in the grid. The balance between the generations reads 1.7 pre-1980 homes for every home built since 2000 — a single ratio that quietly predicts whether a metro's HVAC week leans toward renewal work in the old districts or first-generation upkeep in the new ones.
One line of Richmond arithmetic — a median home 42 years old · 351,455 owner-occupied homes against 172,323 renter-occupied · 1,207 pre-1960 homes for every covered ZIP code · a heating-to-cooling degree-day ratio of 2.39 · 1,156 mm of rain in an average year.
County pages carry the local detail — land area, climate normals and the heating and cooling pressures on the ground in each county.
More plain-language help: the TempReach USA heating & cooling guides
One call connects you with an independent local heating and cooling professional serving Richmond and the surrounding metro.
Call center hours: Mon-Fri 7:00 AM-10:00 PM ET | Sat 8:00 AM-10:00 PM ET | Sun 7:00 AM-9:00 PM ET