

Home / Cities / Georgia / Valdosta

Heating & Cooling Services in Valdosta, GA

Start with the stock, and the rest of the page follows: Valdosta's housing eras, its climate record at VALDOSTA RGNL AP, GA US, and the failure patterns those two manufacture together — ranked, evidenced and answered below. When the pattern matches your home, one call routes you to an independent local HVAC technician who works these streets.

Call center hours: Mon-Fri 7:00 AM-10:00 PM ET | Sat 8:00 AM-10:00 PM ET | Sun 7:00 AM-9:00 PM ET

19
ZIP codes covered
4
Counties in the metro
55,573
Households (Census ACS)
1991
Median year home built
Valdosta, GA — the metro skyline and landscape
Valdosta, GA — heating and cooling help across the metro
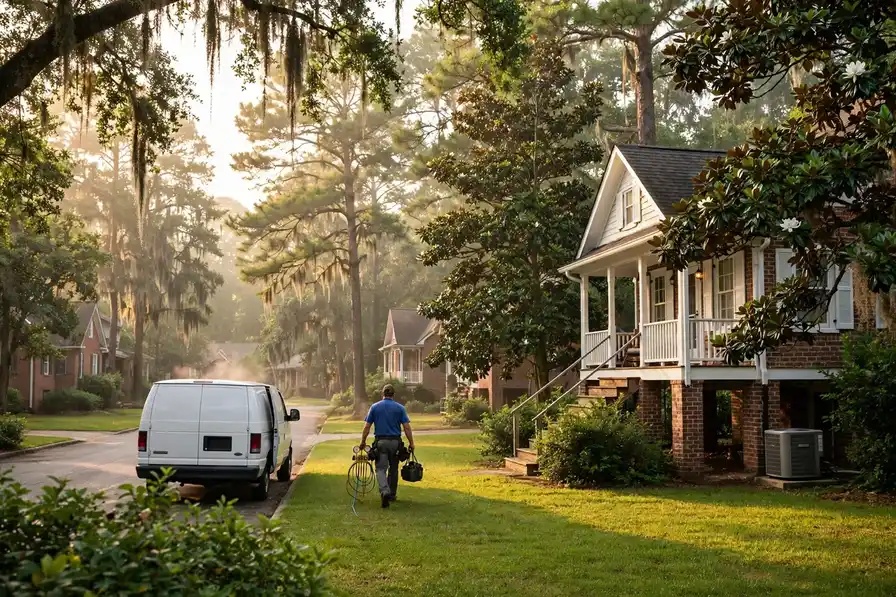
A local HVAC service van on a residential street
Routing local HVAC technicians across the Valdosta metro
An outdoor air conditioning condenser unit in close view
Heating and cooling work across the metro

Valdosta heating & cooling, in brief

The median Valdosta home was built in 1991; 32.1% of the stock predates 1980, and the pattern this metro's own data ranks first is humidity burden on homes and cooling systems. TempReach USA is a referral service, not an HVAC company: one call connects you with an independent local HVAC technician serving your ZIP code.

The Valdosta housing stock, and what it means for heating & cooling

Read Valdosta through its counties and the picture sharpens. Brooks, Echols, Lanier, Lowndes were not built in the same decades or for the same households, and their heating and cooling carries those differences: an older core where 12.0% of the metro's homes predate 1960, growth corridors where the subdivisions arrived in waves, and edges still being built out. The metro-wide medians — a middle home built in 1991, 63,273 housing units in all — are the average of those local stories, and the sections below are organised by the patterns the combined record produces, from the oldest equipment generations to the newest failure modes.

Ask how Valdosta's older homes have been kept comfortable and the honest answer is: in pieces. A furnace here, a condenser there, one room's ducts renewed while the rest of the system carries on — across 20,311 pre-1980 homes, the patchwork is the norm rather than the exception. That history is written in the attics of Brooks County and everywhere else the early stock stands: systems that are part original, part renewed, and entirely individual. It is also why the guidance on this page keeps returning to patterns rather than single faults — in a patchwork system, the pattern is the diagnosis.

The newer side of Valdosta — the 33.0% of homes built since 2000, concentrated around growing communities like Valdosta — runs on matched modern systems that age more gracefully but fail in their own ways: heat pumps and condensers worked hard by 2,410 cooling degree days of hot-season demand, control boards and sensors wearing out in houses that all reach the same age at the same time. One metro, two equipment generations, and the sections below take them in the order this metro's data ranks them.

The weather's part in this is written at VALDOSTA RGNL AP, GA US, where an average year carries 48.41 inches of precipitation, 101.5 days at ninety degrees or more and 21.9 nights at freezing or below. Systems experience that year as workload and as stakes in roughly equal measure — the workload in the run hours, the stakes on the single coldest night and the single hottest week. The problem ranking further down is simply the housing profile above, read under this sky.

The Valdosta heating & cooling profile in numbers

The metro's building eras on one side, its weather record on the other — and its heating and cooling where the two meet.

Break the stock down by building era and the profile sharpens. Before 1960: 12.0% of homes, roughly 7,593 of them. From 1960 to 1979: 20.1%, about 12,718. From 1980 to 1999: 34.9%, about 22,082. Since 2000: 33.0%, about 20,880. Four eras, four equipment generations — and the balance among them is this metro's HVAC character in a single paragraph.

This metro's stock was mostly built in HVAC's transitional decades, 1980 to 1999, and it shows a particular failure calendar: not the deep-design sagas of the old metros, but the wear-out wave of everything installed in those years arriving together — capacitors, igniters, control boards, the first of the modern systems ageing into their verdicts. Valdosta's HVAC story for the next decade is largely written: it is the story of that installed base reaching its limits neighbourhood by neighbourhood.

The second-largest band is the newest: 20,880 homes built since 2000, 33.0% of the metro. Young stock writes young HVAC — condenser waves, control waves, the first heat pump questions — arriving street by street as uniform subdivisions age in lockstep around Bemiss and the growth edge. It is the metro's future workload, visible early to anyone reading the table.

The climate column of this profile is a workload statement. 1,649 heating degree days say how long the cold half of the year keeps furnaces and heat pumps working at their hardest; 2,410 cooling degree days say how relentlessly the hot half loads every condenser and coil; 21.9 freezing nights and 101.5 hot days mark the extremes where the failures concentrate. NOAA keeps these figures at VALDOSTA RGNL AP, GA US as thirty-year normals — which is to say, as the closest thing HVAC has to a settled forecast.

Hold the two halves together and the rest of this page explains itself: the problems ranked highest here are the ones where Valdosta's dominant housing era and its climate record overlap. Change either dataset and the ranking changes — which is precisely why this profile is rebuilt from the records for every metro instead of carried over from the last one.

Heating & cooling problems Valdosta homes actually get

Selected and ranked from this metro's housing-age profile and climate record — not copied from another city's page.

Humidity burden on homes and cooling systems

Ask where a home's humidity actually comes from and the answers are a census of ordinary life: showers, cooking, laundry, breathing, houseplants, a damp crawl space exhaling through the floor, rain finding the grade against the foundation. In Valdosta the outdoor air itself joins the census for much of the year, entering through every leak in the envelope and every return-duct path that crosses a humid space. The air conditioner is expected to process the sum of it. That expectation is reasonable only when the system's drying capacity is matched to the load — and the load is a property of the house and its climate together, which is why two identical systems on the same street can leave one house crisp and another sticky: the houses are importing different amounts of water, and only one system's setup accounts for it.

The physics of the burden are worth stating plainly. Air holds water as vapor; the amount it can hold rises with temperature, which is why warm air arriving in a Valdosta summer carries so much of it indoors. A cooling coil removes moisture by passing air across a surface cold enough for water to condense on it — the same physics that beads a cold glass. Two conditions govern how much condenses: how long the air stays against the cold coil, and how cold the coil runs. Short cycles starve the first; high airflow can starve the second. Meanwhile the house keeps adding vapor from living and from its own damp places, and the envelope keeps trading air with the outdoors. Indoor humidity is the running balance of that account — removal by the coil against addition by everything else — and a house that feels damp is simply a house whose account is out of balance in the wet direction.

The precipitation record testifies first: 48.41 inches of rain in an average year at VALDOSTA RGNL AP, GA US means Valdosta's air arrives wet for much of the season, and every cooling system in the metro is a dehumidifier by necessity, whether its setup honors the role or not.

Watch for

  • The condensate drain running weakly, clogging, or tripping its safety switch
  • Wood doors and floors that swell or move noticeably in the humid months
  • A system that cools quickly and shuts off while the house still feels damp

About indoor air quality ➔

The refrigerant transition reaching older systems

It is worth saying plainly what the transition is not. It is not a mandate to replace working equipment, not a deadline after which older systems become unusable, and not a verdict on the many R-22 and early R-410A systems still cooling Valdosta homes adequately. Systems are retired by economics and condition, not by calendar. What the transition changes is the slope of those economics: each year, the older generation's refrigerant and parts grow scarcer while the machine itself grows older, so the repair-versus-replace crossing arrives a little earlier than the same failure would have suggested a decade ago. Honest service practice in this metro states that slope openly and lets the household's own numbers — the unit's age, its condition, its history — make the call. The refrigerant in the pipes has become a fact of the house, like its roof's age: not urgent every day, and unwise to leave unexamined.

Judge a refrigerant-era system by its leak history and its trend, not by a single charge reading. One low reading after many tight years is an event; a pattern of small losses is a biography, and the biography is what the economics should be based on. Valdosta's climate record loads the question at both ends — a leaking system underperforms exactly when VALDOSTA RGNL AP, GA US's 101.5 hot days demand its full capacity, and its owner pays for refrigerant and lost performance simultaneously. The households that navigate this transition well keep one habit: they can state their system's age, refrigerant and last three repairs without looking them up. That small command of the facts converts an industry-wide generational change into a single household's managed decision, which is the scale at which it was always going to be decided anyway.

The climate loads the stakes: a leaking system in Valdosta underperforms through 101.5 days a year at 90 degrees or more at VALDOSTA RGNL AP, GA US, so the household pays the transition's toll twice — in refrigerant and in lost cooling — until the underlying decision is made.

Watch for

  • Ice forming on lines or coils, the classic signature of a charge running low
  • A repair conversation in which the refrigerant itself has become a significant part of the discussion
  • A nameplate you cannot identify the refrigerant from — worth reading before any major repair is approved

About ac repair ➔

Air conditioners overworked by extreme heat

Heat is a workload before it is a weather report. Every degree above the design range asks the outdoor unit in a Valdosta home to reject heat into air that is already hot, which is the hardest version of its job, and it asks for that work for the longest hours of the year. The parts that answer — compressor, fan motor, capacitor, contactor — are wear items, and sustained heat spends them faster than mild weather ever does. That is why the metro's cooling calls cluster in the hottest stretches rather than spreading across the summer: the systems were not broken in June, they were being used up by July, and August collects the difference. A system that has cooled adequately for years can still be the one that stops in a heat wave, not because it suddenly aged, but because the heat finally asked for more than its remaining margin.

Households tend to judge a cooling system by its mildest day. On a mild day an overworked system still copes, still reaches the setting, still argues for another season. Judge it by its hottest week instead: the hours it ran without pausing, the afternoons the house drifted upward, the nights it needed to recover. In Valdosta, VALDOSTA RGNL AP, GA US keeps the honest record of that week — 101.5 days a year over 90 degrees is the examination the system actually sits. The homes that fare well in it are rarely the ones with the newest equipment; they are the ones whose owners believed the early chapters of the strain story — the lengthening runs, the fading afternoons — and had the wear items checked while the system was still arguing its case.

The climate record makes the pattern's case on its own: 101.5 days a year at 90 degrees or more at VALDOSTA RGNL AP, GA US, stacked into a season of 2,410 cooling degree days. Every system in Valdosta sits that examination; the ones that fail it are the ones whose wear items were already spent when the heat arrived.

Watch for

  • The system runs for hours without reaching the thermostat setting on hot afternoons
  • Cooling that fades as the day heats up, then recovers after sunset
  • The outdoor unit starting roughly, buzzing, or tripping the breaker in hot weather

About ac repair ➔

Surviving the long hot season in Valdosta

Preparation for a Valdosta summer is a short list done before the heat makes it urgent: clear the outdoor unit's breathing room, renew the filter, flush the condensate line, and give the system one full-load rehearsal while a repair, if it needs one, is still a scheduled visit rather than a heat-wave call. The record at VALDOSTA RGNL AP, GA US — 101.5 days a year over 90 degrees — is the schedule the season will keep; the systems that meet it with clean coils and healthy starting components treat it as a routine, and the ones that meet it carrying spring's neglect meet it as an examination.

The season loads Valdosta's systems the way its record at VALDOSTA RGNL AP, GA US says it will: 1,649 heating degree days against 2,410 cooling degree days in an average year, against a housing stock whose median build year is 1991. The households that read the season early — filters, drains, a system run before the extreme weeks — are the ones whose calls stay schedulable.

A closer look: humidity burden on homes and cooling systems in Valdosta

The burden has an address pattern in Valdosta, and it follows water's own map. The low ground and the older districts — the streets around Valdosta and the housing that grew before modern drainage and vapor standards — carry the metro's dampest houses: crawl spaces close to grade, foundations that have managed a century of rain, ductwork running through the wettest air in the home. The 20,311 pre-1980 homes concentrate these conditions, and their cooling systems inherit a drying load that newer construction on higher, drier detailing simply does not present. Add the climate's own delivery — the wet season pressing in through every envelope leak — and the humidity map of the metro is drawn twice over, once by its terrain and once by its building history. Technicians who work the map know which neighborhoods' calls will mention the smell, the sweating registers and the sticky rooms before the homeowner finishes the sentence.

Why here and not everywhere: Valdosta pairs 20,311 pre-1980 homes with 101.5 days a year at 90 degrees or more and 21.9 nights below freezing. Every metro pairs its housing with its weather somehow; this particular pairing is what puts the pattern where it sits on this page's list, ahead of problems that dominate metros built in other decades, under other skies.

Experienced local practice starts with the simple certainties — the observations that take minutes and decide the most:

  • Moisture sources in order: crawl space or basement damp, exhaust fans venting indoors or into the attic, plumbing weeps
  • Return duct paths, to catch humid air being recruited from attics and crawl spaces
  • Register and window condensation patterns, which locate the rooms where the burden concentrates
  • Whether a dedicated dehumidification or ventilation correction fits the layer where the problem actually lives

Heating & cooling services in Valdosta

Sequenced by this metro's own problem ranking, not by a national catalogue order.

Indoor Air Quality in Valdosta

Honest limits are part of the service. A filter does not remove gases, a lamp on a coil is coil care, and no appliance outruns a damp crawl space. Expect the plan to state what each piece will not do, as plainly as what it will.

Indoor air in Valdosta is a two-season problem. The hot season — 101.5 days at 90 or above — seals homes shut around their air conditioning, and whatever the system recirculates stays in circulation: pollen tracked in during the green months, humidity the coil cannot fully pull down, the ordinary chemistry of a lived-in house. The cold season seals homes the other way, around their heating. Air quality work — filtration, humidity control, ventilation, purification — is sized to that sealed-house reality and to the housing: older homes leak air freely, newer ones hold it tightly, and the remedies differ. The VALDOSTA RGNL AP, GA US record — 1,649 heating degree days, 2,410 cooling — is the backdrop Brooks County technicians plan around.

The local figures behind the service: 55,573 households, indoor humidity driven by 48.41 inches of yearly rain and long humid stretches, pollen seasons that load every return in Brooks County. The assessment measures a home against exactly that climate, not against a generic standard.

More about indoor air quality ➔

AC Repair in Valdosta

The local professional you are connected with reads the system the way it fails: electrical values first, then temperatures and pressures, then airflow, until one finding explains all of the symptoms at once.

One more pattern belongs in the Valdosta picture: repair calls here are also a refrigerant story. Systems fitted in the older decades run on refrigerant generations the industry has been retiring, and every repair on those units weighs the charge's scarcity against the system's remaining life. The technician who explains that arithmetic plainly — what the repair restores, what it cannot assure anyone about next summer — is giving the household the real choice, and in the 20,311 pre-1980 homes it is a conversation held weekly. Ask in Echols County consolidated government and the answer rhymes with Valdosta: same eras, same equipment generations, same calendar of failures.

Count the exposure from the Census side: a median build year of 1991 across 63,273 housing units means half the metro's air conditioners are older than the systems in the growth suburbs around Echols County consolidated government, and summer runtime is the statistic that matters — the repair calls follow it street by street.

More about ac repair ➔

Ductless Mini-Split Systems in Valdosta

Across 19 ZIP codes, Valdosta mini-split systems installed through local professionals are commissioned zone by zone in heating and cooling, with the filter and drain routine handed over in person.

More about ductless mini-split systems ➔

Duct Cleaning in Valdosta

Valdosta homes heat through 1,649 heating degree days and cool through 2,410 cooling degree days a year, so the blower runs in both seasons and the ducts never rest — which is why what has settled in them matters here in every month, not just one.

More about duct cleaning ➔

AC Installation & Replacement in Valdosta

With a median build year of 1991, many Valdosta systems are reaching replacement age together; the professional you are connected with inspects ducts and electrics across 19 ZIP codes before recommending equipment.

More about ac installation & replacement ➔

Furnace Repair in Valdosta

Across 19 ZIP codes, Valdosta heating stock reflects a median build year of 1991 — furnaces at every age, each diagnosed on its own sequence and condition rather than its birthday.

More about furnace repair ➔

Heating Installation in Valdosta

Heating installation in Valdosta starts with a heat-loss calculation across Brooks, Echols, Lanier, Lowndes: the independent local professional measures the home's loss, inspects ducts and venting, and quotes the full scope before work begins.

More about heating installation ➔

Heat Pump Services in Valdosta

Heat pump services in Valdosta test the whole year-round system: the independent local professional covering Brooks, Echols, Lanier, Lowndes reads charge and airflow in both modes, proves defrost, and checks auxiliary heat logic before quoting any work.

More about heat pump services ➔

Thermostat Installation in Valdosta

In Valdosta, the thermostat question splits by housing era: homes from around the median build year of 1991 often lack a common wire in the wall, while newer builds across the 19 covered ZIP codes usually carry one — the local professional checks the cable before choosing the control.

More about thermostat installation ➔

HVAC Maintenance & Tune-Ups in Valdosta

Across Brooks, Echols, Lanier, Lowndes, the service record is the scarcest asset: with a median build year of 1991 across 63,273 homes, many systems around Valdosta have no documented history — and a first tune-up's baseline is what every later decision stands on.

More about hvac maintenance & tune-ups ➔

Emergency HVAC Service in Valdosta

In Valdosta, emergency means weather-relative: 1,649 heating degree days put no-heat calls on a freezing clock each winter, while 2,410 cooling degree days make a dead system a health question each summer — the call center triages against both, using the hours shown on this page.

More about emergency hvac service ➔

Commercial HVAC in Valdosta

In Valdosta, commercial work follows the stock: 63,273 housing units' worth of mixed buildings — offices, retail and restaurants from Valdosta across the 19 covered ZIP codes — each with rooftop units whose service rhythm the local professional sets per building.

More about commercial hvac ➔

What Valdosta books most

Ask where this metro's HVAC diary fills up and the answer is a short story: Humidity burden on homes and cooling systems first, the refrigerant transition reaching older systems close behind, and the services that answer them doing the bulk of the booked work. Everything else on the list above is the supporting cast — necessary, frequent enough, but not what Valdosta's housing stock, at its age and in its climate, principally demands. Read the service list as a weather report for the metro's systems and it stops looking like a catalogue.

From problem to fixed, in Valdosta

A heating and cooling problem inside a Valdosta homePROBLEM
➔
The same system in Valdosta after professional repairSOLUTION

Areas covered in the Valdosta metro

Valdosta

Population 55,222

Bemiss

Population 8,464

Quitman

Population 4,046

Echols County consolidated government

Population 3,705

Hahira

Population 3,404

Lakeland

Population 2,943

Moody AFB

Population 1,570

Remerton

Population 1,430

Dasher

Population 1,212

Lake Park

Population 962

Pavo

Population 647

Morven

Population 527

Also in the Valdosta metro: Fargo (population 470), Barwick (population 335).

Read the grid as a building programme spread over a century. The oldest communities sit where the metro began; the youngest are still adding streets at its edge; and Bemiss and Quitman, with 8,464 and 4,046 residents, stand for the rings in between. Each ring was fitted in its era's equipment, and each is now failing, wearing or holding in its era's characteristic order. The ZIP codes below draw the coverage boundary; the eras inside it draw everything else on this page — the problems ranked, the services ordered, the checks advised.

Also on the Valdosta map: Echols County consolidated government (3,705), Hahira (3,404), Lakeland (2,943), Moody AFB (1,570), Remerton (1,430) — communities spread across Brooks, Echols, Lanier, Lowndes, each with housing from its own growth years. A technician routed through TempReach USA to any of them is working from this same page: the metro data does not change at the city limit, but the housing on your street — its age, its equipment, its attic — is what the visit is really about.

Valdosta ZIP codes we cover

31601, 31602, 31605, 31606, 31625, 31629, 31631, 31632, 31635, 31636, 31638, 31641, 31643, 31648, 31649, 31698, 31699, 31720, 31778

The Valdosta metro in detail

Every metro has a first city and a supporting cast, and the census figures draw the billing plainly here: Valdosta first, with 55,222 residents; Bemiss second at 8,464; Quitman third at 4,046; then the long tail of smaller communities in the grid above. The billing matters less than the building dates — each of these places was fitted with heating and cooling in its own decade, by its own builders — but between them they account for nearly every housing era, equipment generation and failure pattern this page describes.

Administratively the metro is drawn from Brooks, Echols, Lanier, Lowndes — 4 in all — with Brooks County at its centre. County lines do not change how a system runs, but they do shape the paperwork around the work: permits, inspections and code details are county and city business, which is one reason the professional who serves your street is a local one.

Beyond the metro line, the nearest covered metros are Albany, GA (80 miles away), Warner Robins, GA (119 miles) and Macon, GA (141 miles) — separate pages, separate profiles, because their housing and weather records are their own. Homeowners near the boundary sit between two datasets; the ZIP list above, not the map's edge, decides which page was written about your stock.

The region around Valdosta is a set of variations on its theme: Albany, GA, 80 miles off, runs a median build year of 1981 on a metro population of 145,510; Warner Robins, GA (119 miles) medians 1993 on 208,091; Macon, GA (141 miles) medians 1982 on 238,553. Nearness is not sameness — a few decades of median build year separate their heating and cooling as surely as the miles separate their maps.

Count the metro per unit of itself: 3,330 housing units per covered ZIP code; 13,893 households per county; 14 communities sharing 4 county governments. Then weigh the generations against each other — 1.0 older homes for each newer one — and the service pattern on this page stops being a list and becomes a proportion: that much of the diary written by ageing systems, the rest by young ones wearing in.

The Valdosta record in one line — median home age: 35 years · owner-occupied homes: 32,844 · renter-occupied homes: 22,729 · pre-1960 homes per covered ZIP code: 400 · heating-to-cooling degree-day ratio: 0.68 · average rainfall: 1,230 mm a year.

Counties we cover in the Valdosta metro

County pages carry the local detail — land area, climate normals and the heating and cooling pressures on the ground in each county.

Valdosta heating & cooling questions

What area does TempReach USA cover around Valdosta?
Start with the list on this page: 19 ZIP codes, running from the centre of Valdosta out through Bemiss, Quitman and the metro's edge communities, across Brooks, Echols, Lanier, Lowndes. That list is the coverage. A home inside it sits inside the dataset this page was built from — its housing era, its climate station, its problem ranking — and inside the routing area of the independent local HVAC technicians TempReach USA connects callers to. One measure of the footprint: Valdosta accounts for 37.0% of the metro's people, and the remaining share spreads across the communities in the grid — every one of them heated and cooled in its own decade, every one of them a single call from a local professional. If a street sits between Quitman and Echols County consolidated government, it is in; the list was drawn from the Census map of the metro — 4 counties, 19 codes — rather than from a radius around a shop. Read the boundary in its own numbers: the list opens at 31601 by Valdosta (55,222 residents), crosses 31631 near Bemiss (8,464) and 31643 near Quitman (4,046), and closes at 31778 — 19 codes over Brooks, Echols, Lanier, Lowndes in all. Stated as the stock it covers: the era ledger reads 7,593 homes before 1960, 12,718 from 1960-1979, 22,082 from 1980-1999 and 20,880 since 2000 — 63,273 units, 55,573 households, 59.1% of them owner-occupied.
A Valdosta house from about 1991 — which parts of its HVAC system deserve a closer look?
Begin at the thermostat, because a control that has drifted tells the whole system the wrong story. From there, the order is the outdoor unit's condition, the furnace's age against its expected span, then the ducts — the sequence in which the 1990s systems in Valdosta homes generally give their first warnings. The metro's numbers say your home is not unusual in this: 12,718 homes here were built between 1960 and 1979 alone, all reading from the same page. In Valdosta that plays out across 19 ZIP codes, from Valdosta to Bemiss. The same watch-list runs metro-wide: from Bemiss (8,464 residents) to Quitman (4,046) and Echols County consolidated government, across Brooks, Echols, Lanier, Lowndes, the 20,311 pre-1980 homes share the equipment generations this answer describes — which is why a neighbour's breakdown two streets away is worth a homeowner's attention here. The metro context is worth holding onto: 12.0% of the stock predates 1960, and the districts around Bemiss and Quitman hold much of it — your home's neighbours are ageing on the same timetable. The geography repeats the arithmetic: Bemiss (8,464 residents) and Quitman (4,046) hold the same spread of eras as the core around Valdosta, across 19 ZIP codes and Brooks, Echols, Lanier, Lowndes. And the climate pressing on every era alike: 67.0 degrees on average at VALDOSTA RGNL AP, GA US, 101.5 hot days, 21.9 freezing nights, 48.41 inches of rain.
If Valdosta HVAC technicians could prevent one problem, which would it be?
Ask the data and it points at humidity burden on homes and cooling systems. Ask where a home's humidity actually comes from and the answers are a census of ordinary life: showers, cooking, laundry, breathing, houseplants, a damp crawl space exhaling through the floor, rain finding the grade against the foundation. The ranking on this page is rebuilt for every metro from its own Census and NOAA figures, so the problem at the top here is the one Valdosta's homes, specifically, produce most. The backdrop is the same metro-wide: 63,273 housing units working against the VALDOSTA RGNL AP, GA US climate record. The ranking's local weight: Humidity burden on homes and cooling systems sits on top because the stock manufactures it — 20,311 pre-1980 homes, 101.5 hot days and 21.9 freezing nights a year at VALDOSTA RGNL AP, GA US, all pressing the same systems. Homeowners comparing notes across the metro — Valdosta (55,222 residents), Bemiss (8,464), Quitman (4,046) — are comparing the same ranked list, because the ranking was run on all 19 ZIP codes at once. The inputs behind the ranking, era by era: the era ledger reads 7,593 homes before 1960, 12,718 from 1960-1979, 22,082 from 1980-1999 and 20,880 since 2000 — 63,273 units, 55,573 households, 59.1% of them owner-occupied.
Does Valdosta's weather affect my heating and cooling system?
Directly. The long-term normals at VALDOSTA RGNL AP, GA US — 1,649 heating degree days, 2,410 cooling degree days, 48.41 inches of precipitation in an average year — set the local HVAC calendar: deep heating loads through the cold stretch, relentless cooling loads through the hot months, and humidity that the cooling coil has to pull out of the air all summer. Your system does not experience a national climate; it experiences this one. The figures behind that answer, from the station record: a yearly average of 67.0 degrees, 48.41 inches of precipitation, 101.5 days at 90 or above and 21.9 nights at freezing or below — the four numbers this page's seasonal section is built from. It is the same story from Bemiss to Quitman — the stock decides, and this stock's median build year is 1991. That is the metro-wide version; the household version differs by exposure — a shaded lot in Bemiss, an open slab in Quitman (4,046 residents), an attic system in Echols County consolidated government — but the loads themselves, 1,649 heating degree days against 2,410 cooling, are the same sky over every roof in Valdosta. That is why the seasonal advice on this page is dated by VALDOSTA RGNL AP, GA US's record rather than by a national calendar: 101.5 hot days and 21.9 freezing nights draw the two working seasons here. That load lands on 55,573 households across Brooks, Echols, Lanier, Lowndes — 12.0% of their homes predate 1960, a median build year of 1991 — which is why the climate section of this page is arithmetic, not atmosphere. Whose roofs that weather works on: the community ledger reads Valdosta (55,222 residents), Bemiss (8,464), Quitman (4,046), Echols County consolidated government (3,705) and Hahira (3,404), out of 149,139 residents metro-wide.
No heat on a cold night in Valdosta. What happens first?
Check the simple certainties before assuming the worst. Thermostat first: is it set to the right mode, and are its batteries alive if it uses them? Then the filter — a clogged filter can shut a modern system down entirely. Then the breaker panel, and the condensate overflow switch if the indoor unit sits over finished space. If the system smells of burning, trips the breaker again, or ices over solid, stop there and make the call — those are the signs the fault is inside the equipment. In Valdosta, where the record at VALDOSTA RGNL AP, GA US counts 101.5 days a year at 90 degrees or more, a system stopped in the hot stretch is worth treating as time-sensitive rather than a weekend job. Across the metro's 4 counties, Brooks County included, the pattern repeats wherever the housing matches. The local detail that decides how the first minutes go: which side of Valdosta the home sits on. Houses in Bemiss (8,464 residents) and the older districts tend to keep their equipment in basements and closets; homes out toward Quitman (4,046) and Echols County consolidated government more often run attic air handlers and outdoor disconnects — worth knowing before the system stops, across all 19 covered ZIP codes, in a metro where 20,311 homes predate 1980 and the record at VALDOSTA RGNL AP, GA US counts 101.5 days a year at 90 degrees or more. Local records underline the point: VALDOSTA RGNL AP, GA US logs 101.5 days of serious heat a year, and the no-cooling calls that follow them come from the same districts each time — the pre-1980 streets around Valdosta and Bemiss — where systems are oldest and filters least often changed. One fact steadies the first minutes: your home is one of 63,273 in a metro whose median build year is 1991 — the equipment arrangement follows that era, basement furnace in the older stock, attic air handler in the slab rings. True across the whole stock: the era ledger reads 7,593 homes before 1960, 12,718 from 1960-1979, 22,082 from 1980-1999 and 20,880 since 2000 — 63,273 units, 55,573 households, 59.1% of them owner-occupied — the equipment's address changes with the era, the first checks do not. And if the call goes out, the geography that frames it: Valdosta sits 80 miles from Albany, GA, 119 miles from Warner Robins, GA and 141 miles from Macon, GA — three neighbouring metros, three different housing stocks, none of them the stock inside your walls. Learn it street by street if you must: the 31778 subdivisions keep air handlers in attics, the 31649 districts furnaces in closets, the oldest homes out toward 31605 systems a generation deep — the map of equipment is the map of build decades.
When does a Valdosta house cross the line from repairs to a full system replacement?
The odds rise with the housing data: 32.1% of Valdosta homes predate 1980, and the systems serving them are often replacements of replacements by now. The replacement case builds on pattern, not age alone — repairs arriving in sequence, cooling or heating capacity fading season by season, a refrigerant generation the industry has retired. One repair on a sound system earns its keep; the pattern is what earns the replacement conversation. Homeowners in Bemiss (8,464) and Quitman (4,046) read this page for the same reason — the stock there is the same stock. It holds in the 22,082 homes built between 1980 and 1999 just as it holds in the older core. The pattern is not evenly spread: it concentrates in the 20,311 pre-1980 homes, thickest in the founding districts and the first suburbs — the streets around Bemiss and the old core — and thins toward Echols County consolidated government and the growth edge, where the stock is a generation younger. The evidence standard is the same across Brooks, Echols, Lanier, Lowndes: in the 7,593 pre-1960 homes the equipment's service history settles it; in the 1960-1979 ring — 12,718 homes — the sequence of breakdowns settles it. The metro's ledger, for the record: 7,593 pre-1960 homes, 12,718 from 1960-1979, 22,082 from 1980-1999, 20,880 since 2000 — the replacement pattern lives in the first two columns. The ageing equipment's full extent: the era ledger reads 7,593 homes before 1960, 12,718 from 1960-1979, 22,082 from 1980-1999 and 20,880 since 2000 — 63,273 units, 55,573 households, 59.1% of them owner-occupied.
Does TempReach USA employ the HVAC technicians it sends out in Valdosta?
Nobody from TempReach USA will knock on your door, because that is not the service. We connect Valdosta homeowners with independent local heating and cooling professionals; the person who arrives is one of those professionals, working for their own business. What we publish — pages like this one, built from the metro's real housing and climate figures — is the homework we do so the connection is an informed one. The local figures behind it: 20,311 homes from before 1980 and 20,880 built since 2000, sharing one system of streets and weather. From Bemiss to Echols County consolidated government, the model does not change: TempReach USA publishes the homework — this page, built from Valdosta's Census and NOAA records — and routes the call; the independent professional who serves that part of Brooks, Echols, Lanier, Lowndes does everything at the home. The model's footprint on this page is exact: 19 ZIP codes across Brooks, Echols, Lanier, Lowndes, 55,573 households — in every part of it, the professional who arrives is a local business, and TempReach USA's part ends at the connection. Callers from Bemiss (8,464 residents), Quitman (4,046) and Echols County consolidated government get the same plain arrangement: our routing, their technician, their terms — stated here because the metro's 149,139 residents deserve it stated. The arrangement holds in every community: the community ledger reads Valdosta (55,222 residents), Bemiss (8,464), Quitman (4,046), Echols County consolidated government (3,705) and Hahira (3,404), out of 149,139 residents metro-wide.
Which small HVAC jobs prevent big ones in a Valdosta house?
Treat it as a calendar rather than a list. Before the hot stretch: the outdoor unit washed and cleared, the filter fresh, the condensate drain proven, because 101.5 days a year at 90 degrees or more will work the system hard. Before the cold stretch: the heating run once on a mild day, the thermostat's programme reviewed, vents and returns walked and unblocked. Between seasons: a slow look at the ducts you can see and the rooms that never quite match the thermostat. Valdosta's climate writes the schedule; the checks themselves are deliberately ordinary. The local version of the list is set by VALDOSTA RGNL AP, GA US's record and the Census profile together: a median home built in 1991, 48.41 inches of rain in an average year, and the patterns ranked at the top of this page. Another metro's calendar would order the same checks differently; Valdosta's numbers order them this way. Scale the routine to the map and it stays the same half hour: the checks are written for a stock of 63,273 homes spread over Brooks, Echols, Lanier, Lowndes, from the founding streets near Valdosta to the subdivisions past Bemiss (8,464 residents) — one climate, one ageing pattern, one calendar. The calendar's local proof is in the stock figures: 20,311 pre-1980 homes to keep ageing systems alive in, 20,880 post-2000 homes reaching first-replacement age together, and 48.41 inches of rain a year testing every condensate path in Brooks, Echols, Lanier, Lowndes. The checks are sized to the stock's actual eras — a median build year of 1991, 12.0% of it pre-1960 — not to a generic house that exists nowhere in Valdosta. The routine's households, community by community: the community ledger reads Valdosta (55,222 residents), Bemiss (8,464), Quitman (4,046), Echols County consolidated government (3,705) and Hahira (3,404), out of 149,139 residents metro-wide.
Who decided that these are Valdosta's main HVAC problems?
Arithmetic, published. Take the metro's exposure to each known failure pattern — how many Valdosta homes have the equipment age, the layout and the duct condition for it — and multiply by how hard the local climate works that weakness, season after season at VALDOSTA RGNL AP, GA US. Sort descending. That sort is the list above: no editor's hunch, no borrowed ranking from a larger city, just this metro's Census profile and weather record multiplied together. The ranking's geography is visible in the coverage grid: the patterns at the top of the list concentrate where the old stock does — the core around Valdosta, the first suburbs toward Bemiss — while the growth communities past Quitman (4,046 residents) pull the ranking's lower half upward year by year. The sort is re-run from the data, not inherited: 12.0% pre-1960 stock, 32.1% pre-1980, 101.5 hot days against 21.9 freezing nights — the weights are this metro's, so the ranking is. Re-run the sort on any other metro's inputs and a different order falls out; on Valdosta's — 12.0% pre-1960 stock, 32.1% pre-1980, 101.5 hot days, 21.9 freezing nights — this order is the one the arithmetic returns. The scoring's raw material, era by era: the era ledger reads 7,593 homes before 1960, 12,718 from 1960-1979, 22,082 from 1980-1999 and 20,880 since 2000 — 63,273 units, 55,573 households, 59.1% of them owner-occupied. The full local podium the scoring returns: Humidity burden on homes and cooling systems, the refrigerant transition reaching older systems, air conditioners overworked by extreme heat — then the rest of the patterns weighed for Valdosta, each scored on this metro's stock and sky alone. The sort ran over the whole list — from 31601 and 31631 through 31643, 31778 and 31649 to 31605 — and returned one order for all of it, because the inputs were the metro's totals, not any single district's.
Where are Valdosta's oldest homes, and why does it matter for heating and cooling?
Read the metro as an equipment map and the oldest systems draw themselves. Where the building is pre-war and immediate post-war — the centre, the streetcar-era districts, the first ring past them — the ducts are leaky by modern standards and the equipment has been renewed piecemeal for decades. Move outward through Bemiss toward the newest subdivisions and the systems modernise decade by decade. Oldest equipment, oldest map: in this metro they are the same picture. The counts behind the geography: 7,593 pre-1960 homes (12.0% of the metro), concentrated where the map says — the core around Valdosta and the first suburbs in Brooks County — against 20,880 homes built since 2000 at the metro's edge. Concentrations, for the record: the oldest systems sit inside the 7,593 pre-1960 homes, and those homes cluster — the founding core, the streetcar-era streets, the first suburbs in Brooks County — rather than scattering evenly across the 19 covered ZIP codes. County lines annotate the same map: the old core sits in Brooks County, and the rings cross into the rest of Brooks, Echols, Lanier, Lowndes as they widen — the equipment's age follows the building, not the boundary. ZIP by ZIP the same gradient: the oldest systems cluster in the codes nearest the centre — the 31601 side of the list — and the youngest toward 31778 at the edge, across Brooks, Echols, Lanier, Lowndes. The oldest systems' addresses, in codes: the codes run 31601, 31631, 31643, 31778 and 31649 among the 19 on the list, spread over Brooks, Echols, Lanier, Lowndes, with the oldest equipment toward the first codes on the list. Counted under its Census name — the Valdosta metro, 149,139 residents, 59.1% owner-occupied — the oldest layer is a defined population of homes, not a figure of speech.
What should a yearly HVAC check in Valdosta actually include?
Walk it as a technician walks it: thermostat first, while the house is quiet, because a control reading wrong outranks every other clue. Then the outdoor unit — fan, coil, the sound of the compressor starting. Then the indoor unit and its drain, then under the registers' evidence room by room. In Valdosta that walk surfaces the same shortlist season after season, because the housing — median year 1991 — keeps offering the same weaknesses. In Valdosta the walk has local emphases: with 32.1% of homes predating 1980, ageing equipment earns an extra look, and with VALDOSTA RGNL AP, GA US recording 21.9 freezing nights a year, the heating half of the system earns one too. The order stays the same; the attention follows the data. The walk's findings repeat across the footprint with local accents: tired igniters in Bemiss's older streets, condenser wear in the growth subdivisions past Quitman, duct leakage in the slab tracts toward Echols County consolidated government — one shortlist, read against 63,273 homes under VALDOSTA RGNL AP, GA US's sky. Keep the findings with the house records: in a metro of 55,573 households, the homes whose owners can date their last check are the ones whose failures arrive as appointments — the entire point of the half hour. District accents, with figures: Bemiss (8,464 residents) leans to furnaces and controls, Quitman (4,046) to condensers and drains, Echols County consolidated government to first-generation systems — one walk, three readings. The walk's stock, counted before the door opens: the era ledger reads 7,593 homes before 1960, 12,718 from 1960-1979, 22,082 from 1980-1999 and 20,880 since 2000 — 63,273 units, 55,573 households, 59.1% of them owner-occupied.

More plain-language help: the TempReach USA heating & cooling guides

Nearby metro areas

Talk to a Valdosta HVAC technician

Describe the problem and the call center routes you to an independent local HVAC technician who works in the Valdosta metro.

Call center hours: Mon-Fri 7:00 AM-10:00 PM ET | Sat 8:00 AM-10:00 PM ET | Sun 7:00 AM-9:00 PM ET

Call Now
