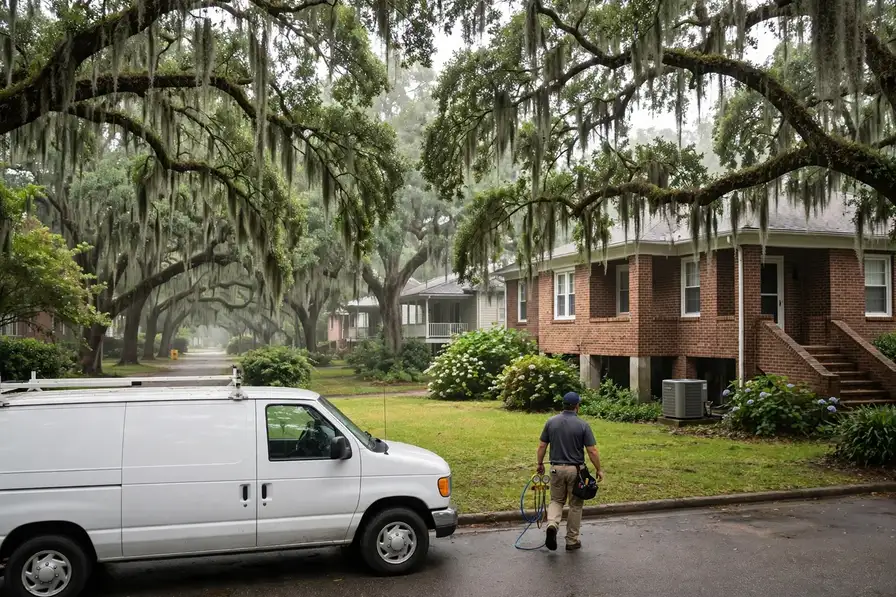


This is Savannah's heating and cooling page, built from Savannah's own numbers: Census housing figures, the metro's ZIP codes and its NOAA climate record. TempReach USA routes your call to an independent local HVAC technician; the homework below is here so you know your home's likely problems before you ever make it.
Call center hours: Mon-Fri 7:00 AM-10:00 PM ET | Sat 8:00 AM-10:00 PM ET | Sun 7:00 AM-9:00 PM ET
The median Savannah home was built in 1990; 36.8% of the stock predates 1980, and the pattern this metro's own data ranks first is humidity burden on homes and cooling systems. TempReach USA is a referral service, not an HVAC company: one call connects you with an independent local HVAC technician serving your ZIP code.
Savannah is a metro of 412,089 people and 158,617 households, and its heating and cooling is a portrait of its building history. The median home here was built in 1990; 36.8% of homes predate 1980 and 19.1% predate 1960, while 37.4% have arrived since 2000. Every one of those eras heated and cooled differently — different furnaces, different duct designs, different refrigerant generations — and they fail differently, which is why this page is organised around the patterns the data actually produces in Savannah rather than HVAC in the abstract.
Ask how Savannah's older homes have been kept comfortable and the honest answer is: in pieces. A furnace here, a condenser there, one room's ducts renewed while the rest of the system carries on — across 65,712 pre-1980 homes, the patchwork is the norm rather than the exception. That history is written in the attics of Bryan County and everywhere else the early stock stands: systems that are part original, part renewed, and entirely individual. It is also why the guidance on this page keeps returning to patterns rather than single faults — in a patchwork system, the pattern is the diagnosis.
The growth side of the metro tells the opposite story in the same language. Pooler, Richmond Hill and the subdivisions still filling in account for much of the 66,783 homes built since 2000 — matched systems, planned ductwork, heat pumps where the lots suit them. Their HVAC is not old; it is uniform, which creates its own calendar: everything installed in the same boom reaches each wear point in the same years, from the first condenser replacements to the first control-board failures, while 2,596 cooling degree days of annual heat keep demand on the system high.
The climate written over all of it comes from the NOAA station at SAVANNAH INTL AP, GA US: an average year brings 1,675 heating degree days, 2,596 cooling degree days and 48.12 inches of precipitation. Those are not abstractions to a furnace or a condenser — they set how many hours a heating system runs each winter, how hard a cooling system cycles in July, and how much moisture every coil has to pull out of the indoor air. The problem sections that follow are selected by exactly these numbers, combined with the housing-age profile above.
Two public records, one metro: what was built here, and what the sky does to it.
Lay the eras side by side instead: 19.1% pre-1960 (34,106 homes), 17.7% from 1960-1979 (31,606), 25.8% from 1980-1999 (46,070), and 37.4% since 2000 (66,783). No single era tells the story — the proportions among them do, and those proportions are different in every metro this site covers.
Read this metro's profile as a before-and-after photograph with the after still developing: the post-2000 band leads, the older bands trail, and every year the balance tips further toward young systems with young problems. Savannah's HVAC volume already lives in the new stock — its condenser waves, its sensor waves, its heat pump questions — while its deepest single jobs still come from the old core. Both facts are in the numbers above; a local technician's week is simply where they meet.
Second in the table, the 1980-1999 band: 46,070 homes, 25.8% of the metro. Its systems are mature rather than ancient — ducts still sound, first-generation efficiency equipment wearing toward its verdicts, controls reaching their wear points in waves — and its HVAC is the schedulable kind: work that rewards being booked before it becomes urgent.
The climate half of the profile, from SAVANNAH INTL AP, GA US: 1,675 heating degree days against 2,596 cooling degree days, 48.12 inches of precipitation, an average temperature of 67.4 degrees. Read together, those figures describe the loads: how many hours a furnace runs in a year, how relentlessly a condenser cycles through summer, how much moisture the cooling coil must pull from the air — 21.4 nights at or below freezing, against 80.5 days at 90 or above.
That is the whole method of this page in one section: era shares from the Census, loads from NOAA, and a problem list that is simply where the two overlap most in Savannah. The services and guidance that follow are ordered by the same profile — local first, generic last.
Ordered by what this metro's data says its homes need most.
The MERV number is a match, not a score. The right filter figure is the highest the blower and ducts can pull air through without strain or bypass — chosen for the furnace in the basement, not the shelf in the store.
Air quality work in Savannah also has a quiet economics of attention: the households that measure first — a hygrometer on the wall, the filter inspected monthly against the light — tend to need the least equipment, because they catch the simple causes early: the filter long past its season, the bath fan venting into an attic, the return pulling unconditioned air through a leaky duct in the pre-1980 districts. The assessment visit formalises that attention with instruments, and prescribes in proportion to what it finds. Count it in homes if you prefer: 65,712 built before 1980, 66,783 since 2000, one shared system of streets and seasons.
Air quality demand in this metro is written by its sealed seasons: 80.5 hot days with the windows shut around the cooling, 21.4 freezing nights with them shut around the heat. The 66,783 post-2000 homes hold their air tightest; the older districts around Pooler exchange theirs with attics and crawl spaces.
Every repair through TempReach USA follows the same order: diagnosis at the equipment, findings explained, quote given before work begins, and a full test cycle before the technician leaves your Savannah home.
Cooling failure in Savannah is rarely random. It bunches on the first serious heat wave, again in the late-summer grind, and it concentrates where the equipment is oldest — the pre-1980 districts, 36.8% of the metro's housing — and where the newest subdivisions' identical units reach the same wear points in the same seasons. The technician who works these streets stocks the van for both patterns: the ageing system's slow decline and the young fleet's shared failures. From Pooler to Richmond Hill, the pattern repeats wherever the housing era matches.
Count the exposure from the Census side: a median build year of 1990 across 178,564 housing units means half the metro's air conditioners are older than the systems in the growth suburbs around Wilmington Island, and summer runtime is the statistic that matters — the repair calls follow it street by street.
In Savannah, the drip from an indoor unit is a drainage story — a clogged line, a failed pump, a route without fall — and it is corrected at the drain path, not wiped up and watched.
Ductless systems find their Savannah homes where ductwork never went: the older districts' additions and converted spaces, the pre-1960 homes — 19.1% of the metro — built around boilers or gravity heat, the workshops and finished basements of the growth suburbs. A mini-split heats and cools a defined space without asking the house to grow ducts, which is why the assessment starts with the space itself: its exposure, its insulation era, how it is actually used across 80.5 hot days and the winter's coldest weeks. In Savannah that holds across 24 ZIP codes, from Savannah out to Richmond Hill.
Scale the question by the Census count and it stays concrete: 178,564 housing units, a share of them holding rooms — additions, conversions, finished spaces — that no duct serves. The mini-split visit exists to give one of those rooms its own climate, sized to its exposure and use.
Savannah homes heat through 1,675 heating degree days and cool through 2,596 cooling degree days a year, so the blower runs in both seasons and the ducts never rest — which is why what has settled in them matters here in every month, not just one.
With a median build year of 1990, many Savannah systems are reaching replacement age together; the professional you are connected with inspects ducts and electrics across 24 ZIP codes before recommending equipment.
Furnace repair in Savannah follows the sequence: the independent local professional covering Bryan, Chatham, Effingham watches your furnace attempt a start, tests the stage that failed, and quotes before work begins.
From Savannah to Wilmington Island, Savannah installations routed through TempReach USA finish with commissioning — combustion, temperature rise and airflow verified — so the fitted system is the specified system.
From Savannah to Wilmington Island, Savannah heat pump calls through TempReach USA reach a local professional who explains findings plainly and quotes after assessing — in the heating season and the cooling season alike.
From Savannah to the metro's edge, Savannah's 178,564 homes run every system type there is — single-stage furnaces, two-stage equipment, heat pumps with auxiliary heat — and each gets a control matched to its terminals, not a shelf guess.
From the oldest housing in Savannah to the newest subdivisions in its 24 covered ZIP codes, the tune-up's question is identical and local at once: what do this system's measurements say, this season, before the weather asks it anything hard?
In Savannah, emergency means weather-relative: 1,675 heating degree days put no-heat calls on a freezing clock each winter, while 2,596 cooling degree days make a dead system a health question each summer — the call center triages against both, using the hours shown on this page.
Savannah's commercial buildings span every era around a median build year of 1990 — and with the era goes the equipment, from aging single units over old storefronts to multi-zone systems in new developments, all serviced from a per-unit record.
Ask where this metro's HVAC diary fills up and the answer is a short story: Humidity burden on homes and cooling systems first, the refrigerant transition reaching older systems close behind, and the services that answer them doing the bulk of the booked work. Everything else on the list above is the supporting cast — necessary, frequent enough, but not what Savannah's housing stock, at its age and in its climate, principally demands. Read the service list as a weather report for the metro's systems and it stops looking like a catalogue.
Chosen by this metro's own housing and weather data — the same two records this whole page is built from.
Indoor air quality work begins, in a humid climate, with the admission that moisture is the master variable. Control the moisture and the mold risk falls, the dust mite population thins, the musty chemistry of damp materials quiets, and the cooling system stops fighting a second invisible load. In Savannah that control is a layered project: the envelope and crawl space deciding what enters, the cooling system and any dedicated dehumidification deciding what is removed, ventilation deciding what is exchanged deliberately rather than accidentally. No single gadget carries the project; the layers do. The households that get there describe the result in comfort language — the house feels right at a normal setting — but the mechanics underneath are moisture mechanics, measured in indoor relative humidity readings taken room by room, season by season, against the record at SAVANNAH INTL AP, GA US.
Working a humidity complaint follows the water. The first measurements are indoor: relative humidity readings in several rooms, at several times, since a single reading at the thermostat flatters the story. The second look is at the equipment's drying setup — system size against the home's actual load, airflow across the coil, cycle length on a typical afternoon, and the condensate drain's condition and output. The third look is at the sources: crawl space or basement moisture, bathroom and kitchen exhausts that vent into attics instead of outdoors, plumbing weeping quietly somewhere, grade and gutters delivering rainwater to the foundation. Only then does the remedy conversation make sense, because each layer has its own remedy — equipment setup, dedicated dehumidification, ventilation correction, source control — and prescribing from one layer for a problem living in another is how humidity complaints survive multiple service visits.
Housing stacks the burden: Savannah's 65,712 pre-1980 homes bring crawl spaces, older envelopes and duct runs through damp air to the contest. The moisture a system must remove is set by the house it serves — and much of this metro's housing imports generously.
Leaks are where the transition stops being abstract. A slow leak on a current-generation system is an ordinary repair story: find it, fix it, recharge. The same leak on an R-22 system in Savannah opens a ledger. The refrigerant itself is drawn from a shrinking reclaimed supply; the system is, by definition, of an age where the leak may not be its last; and the money spent returning it to service buys time on a machine whose other components have aged alongside it. None of that decides the answer by itself — plenty of R-22 systems justify a repair and serve well afterward — but it changes the questions: how old is the unit, where is the leak, what else is worn, and what would the same money mean applied to a current-generation replacement? Households that ask those four questions with the numbers in front of them make the decision once; households that skip them often make it repeatedly, one hot season at a time.
A transition-aware service visit has a recognizable order. First, identification: the nameplate's refrigerant, model and year, stated aloud so the household and technician share the fact. Second, the leak question, taken seriously — a system low on charge has a leak until proven otherwise, and recharging without finding it is buying the same refrigerant twice on an installment plan. Third, the condition audit around the failure: compressor health, coil condition, electrical wear, because the decision the household faces is about the whole machine, not the one part that stopped. Fourth, the comparison itself, presented as what it is — the repair path with its realistic horizon, the replacement path with its — so the choice is made on the machine's merits and the household's plans for the home. In Savannah that conversation, held in a calm season, is unhurried and genuinely optional-feeling; held in a heat wave, the same facts arrive wearing a deadline.
Count the generations the way a technician's route does: a single Savannah street can hold an R-22 veteran, two R-410A systems and a current-generation installation within a few doors. The service records of one metro contain the whole transition — which is why identification, not assumption, opens every diagnosis here.
Zoning is the structural answer built for exactly this geometry: dampers in the duct network, a thermostat for each zone, and a control that lets the single system answer different areas on different calls. The upstairs can hold its setting without freezing the downstairs; the addition can call without dragging the whole house with it. In Savannah's larger homes — the multi-storey plans that multiplied in the the 1990s decades and after — zoning converts one compromised average into several kept settings. It is not the right answer everywhere: it needs ductwork that can be sectioned sensibly and a system whose sizing and controls suit the arrangement, which is why the assessment starts with the network's map. But where the map allows, zoning answers the complaint at its actual address — the mismatch between one measurement point and a houseful of different needs.
Judge a multi-room home at its extremes, not at its thermostat. The thermostat sits, by convention, in the home's most average room, and it will report contentment while the nursery roasts and the end office freezes. The extremes are the system's true report card, and in Savannah they follow the climate record honestly: 80.5 hot days audit the upstairs, 21.4 freezing nights audit the far rooms over unheated spaces, and the household learns its home's real climate map from the rooms it avoids in each season. Homes whose extremes are comfortable have been sorted — by design, by correction or by dedicated equipment — and homes whose extremes are endured are carrying an unsorted map. The sorting is a solvable problem in essentially every case; what it cannot survive is being mistaken for an equipment failure and treated with a bigger version of the same single answer.
The climate record sets the pattern's stakes in Savannah: 2,596 cooling degree days load the upper floors through the summer while 1,675 heating degree days expose the far rooms all winter. A house with an unsorted delivery map is audited at both ends of the year — the pattern is not seasonal, it is structural, and the seasons merely take turns proving it.
There is a particular sound to a heat-stressed system: the outdoor unit starts, labors, and settles into a run that does not end. In Savannah, where 2,596 cooling degree days stack the season's demand into long hot weeks, that endless run is the system telling the household its margin is gone. It may still be cooling — that is the trap. A unit can hold a house five degrees above the set point for days while spending its components to do it, and the repair that eventually follows is dated from when the margin ran out, not from when the cooling stopped. Reading the run time is therefore part of the diagnosis: a technician asks not only what failed, but how long the house had been asking for more than the system had left.
Households tend to judge a cooling system by its mildest day. On a mild day an overworked system still copes, still reaches the setting, still argues for another season. Judge it by its hottest week instead: the hours it ran without pausing, the afternoons the house drifted upward, the nights it needed to recover. In Savannah, SAVANNAH INTL AP, GA US keeps the honest record of that week — 80.5 days a year over 90 degrees is the examination the system actually sits. The homes that fare well in it are rarely the ones with the newest equipment; they are the ones whose owners believed the early chapters of the strain story — the lengthening runs, the fading afternoons — and had the wear items checked while the system was still arguing its case.
The evidence is in the calendar as much as the equipment. Heat failures in Savannah cluster in the season's hottest stretches — the same weeks SAVANNAH INTL AP, GA US records its highest readings — because the load, not luck, is what finishes weakened components.
Twice a year, Savannah changes its mind. The shoulder seasons — the weeks when a house can need heating in the morning and cooling by afternoon, sometimes within the same day — ask more of a system and its household than either deep season does: both modes in working order at once, controls set for change rather than for a settled pattern, and equipment that may sit idle for stretches and then be called on without ceremony. The record at SAVANNAH INTL AP, GA US frames the workload honestly — 1,675 heating degree days against 2,596 cooling degree days, a genuinely two-season climate — and the shoulders are where the two halves meet and negotiate. The checks that matter are changeover checks: the season just ending reviewed for what it spent — the filter, the wear items, the symptoms it filed — and the season arriving proven before it is needed, with a full run in the new mode while the weather is still forgiving. The thermostat's program belongs in the same check; last season's schedule, carried forward unexamined, is how a house ends up heating against an open-window afternoon. Households that treat the shoulders as their maintenance seasons get two calm, well-timed looks at their system a year — which is exactly the rhythm the equipment's manufacturers had in mind.
The season loads Savannah's systems the way its record at SAVANNAH INTL AP, GA US says it will: 1,675 heating degree days against 2,596 cooling degree days in an average year, against a housing stock whose median build year is 1990. The households that read the season early — filters, drains, a system run before the extreme weeks — are the ones whose calls stay schedulable.
The burden has an address pattern in Savannah, and it follows water's own map. The low ground and the older districts — the streets around Savannah and the housing that grew before modern drainage and vapor standards — carry the metro's dampest houses: crawl spaces close to grade, foundations that have managed a century of rain, ductwork running through the wettest air in the home. The 65,712 pre-1980 homes concentrate these conditions, and their cooling systems inherit a drying load that newer construction on higher, drier detailing simply does not present. Add the climate's own delivery — the wet season pressing in through every envelope leak — and the humidity map of the metro is drawn twice over, once by its terrain and once by its building history. Technicians who work the map know which neighborhoods' calls will mention the smell, the sweating registers and the sticky rooms before the homeowner finishes the sentence.
Strip the pattern down to its inputs and the ranking stops being mysterious: 158,617 households depending on systems installed across a median build year of 1990, in a climate that swings between 80.5 days of serious heat and 21.4 freezing nights. Whatever pattern a metro with those inputs manufactures most, it manufactures here — the lead position is less a title than a consequence, recalculated from the same public records any sceptic can check.
On a first visit for this pattern, a local technician's checks run in a practised order:
PROBLEM SOLUTION
Population 147,546
Population 27,235
Population 17,408
Population 14,457
Population 11,997
Population 11,606
Population 11,152
Population 10,375
Population 8,907
Population 6,918
Population 4,704
Population 4,640
Also in the Savannah metro: Tybee Island (population 3,121), Bloomingdale (population 2,983).
Beyond Savannah itself, the metro takes in Pooler (27,235 residents), Richmond Hill (17,408) and the rest of the communities in the grid above — each fitted with heating and cooling in its own building era, which is why two streets in the same metro can need entirely different HVAC conversations. The ZIP list below is the full coverage footprint: if your code is on it, this page was written about your housing stock.
Beyond the largest communities sit Wilmington Island (14,457), Port Wentworth (11,997), Georgetown (11,606), Rincon (11,152), Garden City (10,375) — smaller places across Bryan, Chatham, Effingham, covered on the same terms. Their housing tends to be older on average than the big suburbs', and their calls follow the older patterns on this page. One routing covers them all: find your ZIP code below and the rest is a phone call.
Every metro has a first city and a supporting cast, and the census figures draw the billing plainly here: Savannah first, with 147,546 residents; Pooler second at 27,235; Richmond Hill third at 17,408; then the long tail of smaller communities in the grid above. The billing matters less than the building dates — each of these places was fitted with heating and cooling in its own decade, by its own builders — but between them they account for nearly every housing era, equipment generation and failure pattern this page describes.
The metro answers to 3 county governments (Bryan, Chatham, Effingham), a patchwork that matters at permit time rather than at the thermostat. Bryan County carries the centre; the others carry the growth rings and the older outlying towns. A technician routed through this page works inside that patchwork daily — the weather does not care about the boundaries, but the job's paperwork does.
This page ends at the metro boundary, but the region does not: Augusta, GA, Valdosta, GA and Warner Robins, GA continue the coverage in their own directions, each with a profile built from its own Census and NOAA figures. If your home sits near the line between metros, go by your ZIP code — it places you in the dataset that describes your housing.
Set Savannah among its neighbours and the contrasts sharpen the profile: Augusta, GA — metro population 641,231, median build year 1987 — sits 108 miles away; Valdosta, GA (153,276, median 1991) 143 miles; Warner Robins, GA (208,091, median 1993) 146 miles. Three different housing stocks under three nearby skies, which is why each keeps its own page and its own problem ranking rather than borrowing this one.
Ratios tell the metro's story compactly. Renters occupy 38.5% of homes; owners hold the rest. For every home built since 2000 there are 1.0 from before 1980. Spread the stock across the coverage map and each ZIP code carries about 7,440 housing units — the density at which era patterns repeat street after street instead of scattering, and at which a routed round of calls stays inside a few districts.
The Savannah record in one line — median home age: 36 years · owner-occupied homes: 97,549 · renter-occupied homes: 61,068 · pre-1960 homes per covered ZIP code: 1,421 · heating-to-cooling degree-day ratio: 0.65 · average rainfall: 1,222 mm a year.
County pages carry the local detail — land area, climate normals and the heating and cooling pressures on the ground in each county.
More plain-language help: the TempReach USA heating & cooling guides
TempReach USA routes your call to an independent local heating and cooling professional serving Savannah — the assessment and the work are theirs.
Call center hours: Mon-Fri 7:00 AM-10:00 PM ET | Sat 8:00 AM-10:00 PM ET | Sun 7:00 AM-9:00 PM ET