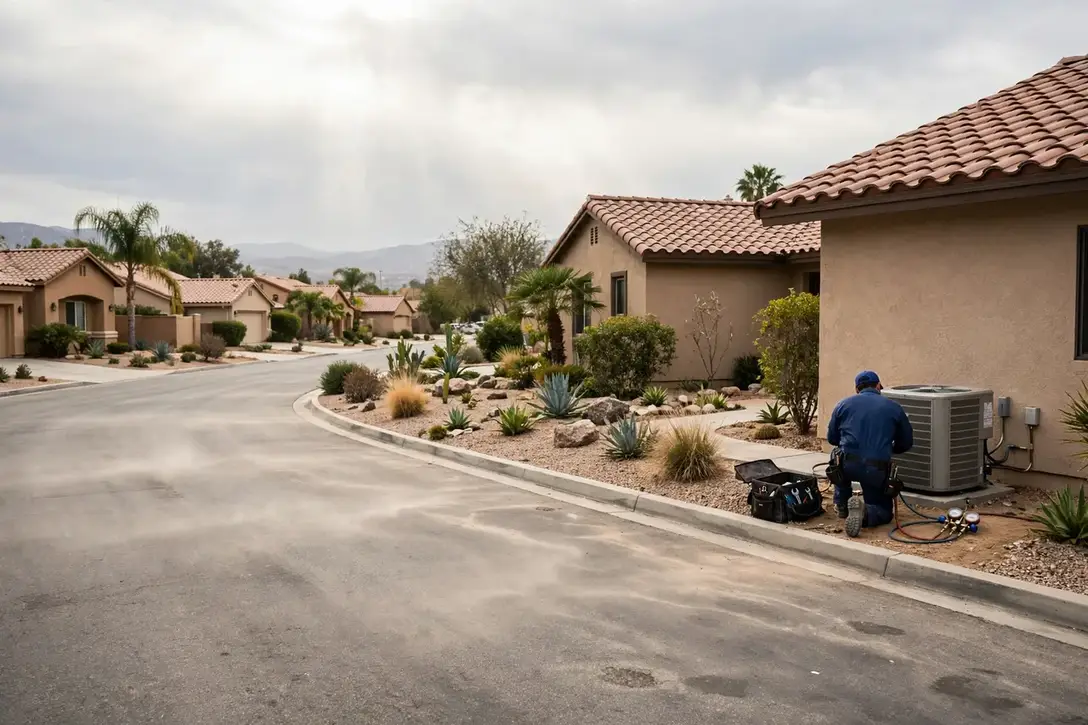


Everything on this page was computed for Riverside–San Bernardino and nowhere else: the problem ranking from its Census housing profile, the seasonal risks from its NOAA station record, the coverage from its own ZIP codes. TempReach USA connects you to an independent local HVAC technician; the page itself is the homework, done in public, so the call you make is an informed one.
Call center hours: Mon-Fri 7:00 AM-10:00 PM ET | Sat 8:00 AM-10:00 PM ET | Sun 7:00 AM-9:00 PM ET
The median Riverside–San Bernardino home was built in 1986; 36.5% of the stock predates 1980, and the pattern this metro's own data ranks first is air conditioners overworked by extreme heat. TempReach USA is a referral service, not an HVAC company: one call connects you with an independent local HVAC technician serving your ZIP code.
Start with the raw material: 4,637,725 people, 1,598,577 housing units, and a housing stock whose middle home was built in 1986. That single date organises everything on this page. On one side of it stand the older districts — 13.4% of homes predate 1960, 36.5% predate 1980 — heated and cooled by systems renewed in pieces for decades, in homes across Riverside, San Bernardino. On the other side, the 28.6% built since 2000 run matched modern equipment, and fail in the newer ways. A Riverside–San Bernardino technician reads a home's build year the way a doctor reads a chart: it predicts, before a single panel is opened, which systems deserve suspicion first.
Ask how Riverside–San Bernardino's older homes have been kept comfortable and the honest answer is: in pieces. A furnace here, a condenser there, one room's ducts renewed while the rest of the system carries on — across 583,481 pre-1980 homes, the patchwork is the norm rather than the exception. That history is written in the attics of Riverside County and everywhere else the early stock stands: systems that are part original, part renewed, and entirely individual. It is also why the guidance on this page keeps returning to patterns rather than single faults — in a patchwork system, the pattern is the diagnosis.
The growth side of the metro tells the opposite story in the same language. San Bernardino, Fontana and the subdivisions still filling in account for much of the 457,193 homes built since 2000 — matched systems, planned ductwork, heat pumps where the lots suit them. Their HVAC is not old; it is uniform, which creates its own calendar: everything installed in the same boom reaches each wear point in the same years, from the first condenser replacements to the first control-board failures, while 4,601 cooling degree days of annual heat keep demand on the system high.
The weather's part in this is written at PALM SPRINGS RGNL AP, CA US, where an average year carries 4.61 inches of precipitation, 176.6 days at ninety degrees or more and 0.3 nights at freezing or below. Systems experience that year as workload and as stakes in roughly equal measure — the workload in the run hours, the stakes on the single coldest night and the single hottest week. The problem ranking further down is simply the housing profile above, read under this sky.
Two public records, one metro: what was built here, and what the sky does to it.
The distribution, in one breath: of every hundred Riverside–San Bernardino homes, 13.4 were standing before 1960, 23.1 went up in the two decades after, 34.9 in the two after that, and 28.6 have arrived since 2000. Percentages flatten the picture, so hold the counts beside them — 214,209 oldest-era homes, 457,193 newest — and the metro's heating and cooling stops being an abstraction: it is that many systems, of those ages, failing in that order.
The metro's HVAC present was installed between 1980 and 1999, and it is ageing as a cohort. That cohort's traits are consistent: sound bones, wearing surfaces. The systems beneath these homes are not failing from ancient design but from the accumulated cycles of two to four decades — and the work they generate is the steady, schedulable kind, provided it is scheduled. Left alone, cohort ageing has a way of arriving all at once; attended to, it is the most manageable profile a metro can have.
The second-largest band is the newest: 457,193 homes built since 2000, 28.6% of the metro. Young stock writes young HVAC — condenser waves, control waves, the first heat pump questions — arriving street by street as uniform subdivisions age in lockstep around San Bernardino and the growth edge. It is the metro's future workload, visible early to anyone reading the table.
Translate the climate record into HVAC terms and it comes out as three working conditions. Condition one, the freeze count — 0.3 nights a year when a heating failure stops being a comfort issue and becomes a household one. Condition two, the heat count — 176.6 days that load condensers, ducts and tempers simultaneously. Condition three, the moisture: 4.61 inches of precipitation arriving as humidity the cooling coil must remove. Riverside–San Bernardino's systems are engineered, installed and aged inside those three conditions, and their failures carry the conditions' fingerprints.
Hold the two halves together and the rest of this page explains itself: the problems ranked highest here are the ones where Riverside–San Bernardino's dominant housing era and its climate record overlap. Change either dataset and the ranking changes — which is precisely why this profile is rebuilt from the records for every metro instead of carried over from the last one.
Selected and ranked from this metro's housing-age profile and climate record — not copied from another city's page.
Extreme heat does not ask an air conditioner to work a little harder; it changes the job entirely. In Riverside–San Bernardino, the record at PALM SPRINGS RGNL AP, CA US counts 176.6 days a year at 90 degrees or more, and on those days a system sized for an average afternoon runs from late morning to well past dark without a pause. Compressors heat-soak, capacitors weaken a fraction with every hard start, contactors pit and stick, and a refrigerant charge that was slightly low in spring becomes the reason the house will not pull down in July. The failure rarely arrives as a single broken part. It arrives as a system that has been spending its reserves for weeks: longer run times, a house that reaches the set point later each day, an outdoor unit that sounds strained at startup. By the time it stops outright, it has usually been reporting the strain for a while. A local technician reading that pattern checks the electrical wear items first, then charge and airflow, because heat-season failures in Riverside County follow the load, and the load is written in the climate record.
Households tend to judge a cooling system by its mildest day. On a mild day an overworked system still copes, still reaches the setting, still argues for another season. Judge it by its hottest week instead: the hours it ran without pausing, the afternoons the house drifted upward, the nights it needed to recover. In Riverside–San Bernardino, PALM SPRINGS RGNL AP, CA US keeps the honest record of that week — 176.6 days a year over 90 degrees is the examination the system actually sits. The homes that fare well in it are rarely the ones with the newest equipment; they are the ones whose owners believed the early chapters of the strain story — the lengthening runs, the fading afternoons — and had the wear items checked while the system was still arguing its case.
Read Riverside–San Bernardino's housing and weather together and the strain stops looking random: a median build year of 1986 means much of the metro's cooling equipment is deep into its working life, and the heat at PALM SPRINGS RGNL AP, CA US asks the oldest systems for the longest runs of the year.
It is worth saying plainly what the transition is not. It is not a mandate to replace working equipment, not a deadline after which older systems become unusable, and not a verdict on the many R-22 and early R-410A systems still cooling Riverside–San Bernardino homes adequately. Systems are retired by economics and condition, not by calendar. What the transition changes is the slope of those economics: each year, the older generation's refrigerant and parts grow scarcer while the machine itself grows older, so the repair-versus-replace crossing arrives a little earlier than the same failure would have suggested a decade ago. Honest service practice in this metro states that slope openly and lets the household's own numbers — the unit's age, its condition, its history — make the call. The refrigerant in the pipes has become a fact of the house, like its roof's age: not urgent every day, and unwise to leave unexamined.
The mechanics underneath the policy are simple. A refrigerant is the working fluid of the cooling cycle: it evaporates indoors to absorb heat and condenses outdoors to release it, thousands of times a season. Each generation of fluid was engineered to improve on the last one's environmental profile and operating pressures, and each required its own hardware — compressors built for different pressures, oils that mix with one fluid and not another, metering set for one fluid's characteristics. That is why the generations cannot be swapped like brands of the same product, and why 'topping up' an older system always means its own fluid, sourced from whatever supply its generation still commands. In Riverside–San Bernardino, where systems from all three generations stand in neighboring yards, the diversity is a service reality: diagnosis begins with identification, because the same symptom — a system low on charge — carries three different expense structures depending on the nameplate.
Housing arithmetic shows the exposure: with 36.5% of Riverside–San Bernardino's homes built before 1980 and equipment replaced in long cycles ever since, a substantial share of the metro's systems belong to refrigerant generations the market has already succeeded. The nameplates say so, one address at a time.
The oversized system is humidity's favorite accomplice. In Riverside–San Bernardino, cooling equipment has often been replaced like for like or rounded up in size over the years, and a unit with more capacity than the house needs satisfies the thermostat quickly — then stops, with the coil warming and its collected moisture still in the air stream's neighborhood. Temperature is a fast variable; moisture is a slow one. A house can hit its setting while barely denting its indoor humidity, and the gap between the two is where the clammy afternoons live. Correct sizing, correct airflow and longer, steadier cycles are the equipment side of the answer; the house side — ventilation of wet rooms, vapor sources managed, drainage and grade outside — decides how much burden arrives for the equipment to carry in the first place.
Working a humidity complaint follows the water. The first measurements are indoor: relative humidity readings in several rooms, at several times, since a single reading at the thermostat flatters the story. The second look is at the equipment's drying setup — system size against the home's actual load, airflow across the coil, cycle length on a typical afternoon, and the condensate drain's condition and output. The third look is at the sources: crawl space or basement moisture, bathroom and kitchen exhausts that vent into attics instead of outdoors, plumbing weeping quietly somewhere, grade and gutters delivering rainwater to the foundation. Only then does the remedy conversation make sense, because each layer has its own remedy — equipment setup, dedicated dehumidification, ventilation correction, source control — and prescribing from one layer for a problem living in another is how humidity complaints survive multiple service visits.
The timing is the signature: humidity complaints in Riverside–San Bernardino peak in the wet, saturated stretches rather than the hottest dry ones — the pattern of a moisture load, not a temperature load, announcing itself through the same equipment.
Renovation writes its own chapter in this pattern. Homes in Riverside–San Bernardino have been extended, finished and re-divided for decades — a garage converted, a basement finished, an addition tied into ductwork sized for the original house. Each alteration borrows air from the existing network, and the borrowing is rarely repaid with new capacity or rebalanced runs. The result is a duct system whose map no longer matches the house it serves: original rooms over-supplied, added rooms fed by a hopeful tap into a trunk that was never asked to carry them. Add the slow leaks of age on top of the redesigns of renovation, and the far rooms' complaints stop being mysterious. The remedy starts with honesty about the map — what was designed, what was improvised, and what each run can actually deliver — before any cleaning, sealing or resizing is worth doing.
The construction details explain the timeline. Duct joints are mechanical connections, and the sealants asked to make them permanent have finite lives: cloth-backed tape dries and releases, foil tape lifts at edges, and even mastic can crack where runs move with the building. Flex duct, common in the metro's later building decades, fails at its connections and where its inner liner is pierced or crushed — and a crushed section quietly throttles every room downstream of it. Meanwhile the spaces the ducts cross work against them: attic temperatures in a Riverside–San Bernardino summer turn an uninsulated or leaking run into a heat exchanger pointed the wrong way, and winter reverses the argument in the crawl space. A duct system is therefore not a fixed asset but a slowly changing one, and its delivered performance in any given year is an empirical question, not a memory of its installation day.
The load figures complete the case: 4,601 cooling degree days and 703 heating degree days at PALM SPRINGS RGNL AP, CA US mean the network is in service in earnest at both ends of the year. Duct loss here is not a summer inefficiency or a winter one; it is a twelve-month tax on a system that works both seasons.
Some rooms should never have been asked to share. The converted garage, the sunroom, the addition over the back, the finished attic in a Riverside–San Bernardino home — these spaces have different walls, different exposure and different loads from the original house, and tying them into the original duct network asked a system sized for one building to serve two. Ductless mini-split equipment answers precisely there: a dedicated indoor unit for the problem space, its own thermostat, capacity matched to that room's actual load, and no dependence on a trunk line that was never designed to reach it. The original system is relieved of its most unreasonable duty at the same moment the room gains honest service. That is why the ductless conversation so often begins with a single room's complaint rather than a whole-house plan — the room was the problem, and the room is what gets its own equipment.
Judge a multi-room home at its extremes, not at its thermostat. The thermostat sits, by convention, in the home's most average room, and it will report contentment while the nursery roasts and the end office freezes. The extremes are the system's true report card, and in Riverside–San Bernardino they follow the climate record honestly: 176.6 hot days audit the upstairs, 0.3 freezing nights audit the far rooms over unheated spaces, and the household learns its home's real climate map from the rooms it avoids in each season. Homes whose extremes are comfortable have been sorted — by design, by correction or by dedicated equipment — and homes whose extremes are endured are carrying an unsorted map. The sorting is a solvable problem in essentially every case; what it cannot survive is being mistaken for an equipment failure and treated with a bigger version of the same single answer.
The climate record sets the pattern's stakes in Riverside–San Bernardino: 4,601 cooling degree days load the upper floors through the summer while 703 heating degree days expose the far rooms all winter. A house with an unsorted delivery map is audited at both ends of the year — the pattern is not seasonal, it is structural, and the seasons merely take turns proving it.
The season does not need to be survived in one heroic effort; it needs to be read in chapters. Early heat exposes weak starting parts. The long middle stretch exposes capacity — systems sized or charged marginally fall behind a degree at a time while running without pause. The humid weeks expose drainage, as condensate runs at full volume and a slowing drain announces itself. Late season exposes fatigue, when components worn by months of starts begin to fail on ordinary days. Between chapters, the household's work is mostly attention: a filter's condition, a drain's flow, the sound of a startup, the temperature at a far register. The season is the metro's longest HVAC fact — 4,601 cooling degree days of it — and it rewards the households that pace their systems through it instead of discovering it all at once.
The season loads Riverside–San Bernardino's systems the way its record at PALM SPRINGS RGNL AP, CA US says it will: 703 heating degree days against 4,601 cooling degree days in an average year, against a housing stock whose median build year is 1986. The households that read the season early — filters, drains, a system run before the extreme weeks — are the ones whose calls stay schedulable.
Consider the arithmetic a Riverside–San Bernardino cooling system actually faces. The season is not a few hot days; it is 4,601 cooling degree days of accumulated demand, delivered disproportionately in long afternoon runs. A system loses capacity slowly as coils foul and charge drifts, while the house's demand stays fixed or grows — so the two lines cross not gradually in the homeowner's experience, but suddenly, on the afternoon the remaining capacity drops below the day's load. The crossing feels like a breakdown out of nowhere. It is a rendezvous years in the making, and the deep lesson of the pattern is that the rendezvous can be moved: cleaning, charge and starting components are the variables, and all three are checkable before the lines meet.
Why here and not everywhere: Riverside–San Bernardino pairs 583,481 pre-1980 homes with 176.6 days a year at 90 degrees or more and 0.3 nights below freezing. Every metro pairs its housing with its weather somehow; this particular pairing is what puts the pattern where it sits on this page's list, ahead of problems that dominate metros built in other decades, under other skies.
Experienced local practice starts with the simple certainties — the observations that take minutes and decide the most:
Ordered by what this metro's data says its homes need most.
Refrigerant is never consumed, so a low charge in a Riverside–San Bernardino home means a leak to be found, not just a top-up to be sold; the repair addresses the cause or the symptom is already on its way back.
One more pattern belongs in the Riverside–San Bernardino picture: repair calls here are also a refrigerant story. Systems fitted in the older decades run on refrigerant generations the industry has been retiring, and every repair on those units weighs the charge's scarcity against the system's remaining life. The technician who explains that arithmetic plainly — what the repair restores, what it cannot assure anyone about next summer — is giving the household the real choice, and in the 583,481 pre-1980 homes it is a conversation held weekly. From San Bernardino to Fontana, the pattern repeats wherever the housing era matches.
Count the exposure from the Census side: a median build year of 1986 across 1,598,577 housing units means half the metro's air conditioners are older than the systems in the growth suburbs around San Bernardino, and summer runtime is the statistic that matters — the repair calls follow it street by street.
In Riverside–San Bernardino this service is booked most often through the problem patterns at the top of this page — the metro's housing data, not habit, sets the order. If your home is in the 36.5% built before 1980, mention its age on the call: it changes the parts the technician loads before heading to Riverside and the rest of the metro.
Moisture cuts both ways. Too little through a heating season cracks wood and dries airways; too much through a cooling season feeds what grows in damp corners. Whole-home control aims at the moving middle, set against the weather outside.
Across Riverside–San Bernardino's 1,430,238 households, the air quality diary follows the building map. The tight new subdivisions near San Bernardino ask about ventilation and the chemistry of new materials; the the 1980s districts ask about dust, infiltration and the crawl spaces under raised floors; the households in between ask about allergies in the pollen months. One service name, three different sciences — which is why the visit begins with questions about the house and the people in it, not with a product sheet. Count it in homes if you prefer: 583,481 built before 1980, 457,193 since 2000, one shared system of streets and seasons.
Air quality demand in this metro is written by its sealed seasons: 176.6 hot days with the windows shut around the cooling, 0.3 freezing nights with them shut around the heat. The 457,193 post-2000 homes hold their air tightest; the older districts around Moreno Valley exchange theirs with attics and crawl spaces.
Where this service gets booked in Riverside–San Bernardino follows the map on this page: the older districts generate the deep-end work, the post-2000 subdivisions the wear-and-tear work, and the 557,903 homes in between split the difference. Telling the call center your home's build decade — most Riverside–San Bernardino owners know it within a few years — puts the right kit on the van the first time.
Clean ducts that leak are still leaking. The inspection folded into a cleaning visit finds the crushed flex run, the separated joint, the filter slot that never sealed — the conditions that decide whether cleaned air actually reaches the rooms.
What comes out of a Riverside–San Bernardino duct system tells the home's biography: drywall dust from the renovation, pet hair in proportion to the household, the fine grit that 4.61 inches of yearly rain and the dry seasons between them work into every return. Cleaning matters most where the biography is long — the pre-1980 homes, 36.5% of the stock — and where a household's breathing argues for it. A technician who shows the before and after, and says plainly when a system does not need the work, is the one whose advice holds up. That is the daily reality for the 1,430,238 households spread across Riverside, San Bernardino.
Duct demand concentrates in the metro's long-biography homes: 583,481 pre-1980 systems that have carried decades of household air, and the renovated homes around Rancho Cucamonga (174,693 residents) whose construction dust is still in the runs.
One local habit worth copying: Riverside–San Bernardino homeowners who mention their street's building era when they book get a better-matched visit, because a technician heading to a the 1980s home in Riverside County loads different parts than one heading to a new-build subdivision in San Bernardino. The service is the same; the preparation is local.
In Riverside–San Bernardino, the drip from an indoor unit is a drainage story — a clogged line, a failed pump, a route without fall — and it is corrected at the drain path, not wiped up and watched.
Mini-splits also answer a Riverside–San Bernardino housing pattern the census tables only hint at: the multigenerational home, the converted space, the workshop that became an office. Across 1,430,238 households, the rooms that need conditioning keep multiplying faster than duct systems can follow, and a ductless head follows in an afternoon's installation where a duct extension would take a renovation. The assessment stays the same — the space, its exposure, its use — but the question it answers is as much about how the household lives as how the house was built. Ask in Moreno Valley and the answer rhymes with Riverside: same eras, same equipment generations, same calendar of failures.
Scale the question by the Census count and it stays concrete: 1,598,577 housing units, a share of them holding rooms — additions, conversions, finished spaces — that no duct serves. The mini-split visit exists to give one of those rooms its own climate, sized to its exposure and use.
In Riverside–San Bernardino this service is booked most often through the problem patterns at the top of this page — the metro's housing data, not habit, sets the order. If your home is in the 36.5% built before 1980, mention its age on the call: it changes the parts the technician loads before heading to Riverside and the rest of the metro.
Replacement in Riverside–San Bernardino begins with a load calculation across Riverside, San Bernardino: the independent local professional measures the home — not the old unit's label — and quotes the full scope before work begins.
Across 162 ZIP codes, Riverside–San Bernardino heating stock reflects a median build year of 1986 — furnaces at every age, each diagnosed on its own sequence and condition rather than its birthday.
From Riverside to Moreno Valley, Riverside–San Bernardino installations routed through TempReach USA finish with commissioning — combustion, temperature rise and airflow verified — so the fitted system is the specified system.
Heat pump services in Riverside–San Bernardino test the whole year-round system: the independent local professional covering Riverside, San Bernardino reads charge and airflow in both modes, proves defrost, and checks auxiliary heat logic before quoting any work.
From Riverside to the metro's edge, Riverside–San Bernardino's 1,598,577 homes run every system type there is — single-stage furnaces, two-stage equipment, heat pumps with auxiliary heat — and each gets a control matched to its terminals, not a shelf guess.
From the oldest housing in Riverside–San Bernardino to the newest subdivisions in its 162 covered ZIP codes, the tune-up's question is identical and local at once: what do this system's measurements say, this season, before the weather asks it anything hard?
Across Riverside, San Bernardino, the local professional who answers knows the stock — a median build year of 1986 across 1,598,577 homes means systems of every age failing in their characteristic ways, from Riverside to the metro's newest subdivisions.
In Riverside–San Bernardino, commercial work follows the stock: 1,598,577 housing units' worth of mixed buildings — offices, retail and restaurants from Riverside across the 162 covered ZIP codes — each with rooftop units whose service rhythm the local professional sets per building.
There is a plainer way to say what this page's ranking means in practice: most calls in Riverside–San Bernardino are two calls. The first answers Air conditioners overworked by extreme heat; the second answers the refrigerant transition reaching older systems. Between them they account for the shape of a local technician's week here — the districts visited, the parts stocked, the diagnoses made fastest because they are made most often. The remaining services divide the rest of the diary among them, essential but episodic, the supporting work around two leading patterns.
PROBLEM SOLUTION
Population 316,241
Population 221,774
Population 211,921
Population 210,378
Population 178,347
Population 174,693
Population 158,839
Population 135,983
Population 111,621
Population 110,404
Population 107,020
Population 106,244
Also in the Riverside–San Bernardino metro: Rialto (population 103,866), Hesperia (population 100,141).
The communities in the grid are not suburbs of the page; they are its subject as much as Riverside is. San Bernardino (221,774 residents) and Fontana (211,921) carry their own building decades, their own equipment generations and their own positions in the problem ranking's logic — a system under a San Bernardino roof answers to the same data as one in the centre, but to a different era of it. Coverage here is defined by the ZIP list below; understanding is defined street by street, and this page's figures are the metro-wide version of a story each community tells in its own numbers.
Also on the Riverside–San Bernardino map: Moreno Valley (210,378), Ontario (178,347), Rancho Cucamonga (174,693), Corona (158,839), Victorville (135,983) — communities spread across Riverside, San Bernardino, each with housing from its own growth years. A technician routed through TempReach USA to any of them is working from this same page: the metro data does not change at the city limit, but the housing on your street — its age, its equipment, its attic — is what the visit is really about.
Every metro has a first city and a supporting cast, and the census figures draw the billing plainly here: Riverside first, with 316,241 residents; San Bernardino second at 221,774; Fontana third at 211,921; then the long tail of smaller communities in the grid above. The billing matters less than the building dates — each of these places was fitted with heating and cooling in its own decade, by its own builders — but between them they account for nearly every housing era, equipment generation and failure pattern this page describes.
Administratively the metro is drawn from Riverside, San Bernardino — 2 in all — with Riverside County at its centre. County lines do not change how a system runs, but they do shape the paperwork around the work: permits, inspections and code details are county and city business, which is one reason the professional who serves your street is a local one.
Beyond the metro line, the nearest covered metros are San Diego, CA (96 miles away), El Centro, CA (96 miles) and Los Angeles, CA (113 miles) — separate pages, separate profiles, because their housing and weather records are their own. Homeowners near the boundary sit between two datasets; the ZIP list above, not the map's edge, decides which page was written about your stock.
The region around Riverside–San Bernardino is a set of variations on its theme: San Diego, CA, 96 miles off, runs a median build year of 1980 on a metro population of 3,282,248; El Centro, CA (96 miles) medians 1988 on 181,411; Los Angeles, CA (113 miles) medians 1969 on 12,844,441. Nearness is not sameness — a few decades of median build year separate their heating and cooling as surely as the miles separate their maps.
The stock has a shape as well as a size. Owners hold 65.4% of it and renters 34.6%, a split that decides who notices a comfort problem first and who arranges the repair. The generations split 1.3-to-one in favour of the pre-1980 homes. And the map divides into 14 named communities across Riverside, San Bernardino, each carrying its era's share of the 1,598,577 housing units the Census counts here.
Riverside–San Bernardino by the derived numbers — median home age 40 years · owners in 935,376 homes, renters in 494,862 · each covered ZIP code carrying about 1,322 pre-1960 homes · a heating-to-cooling degree-day ratio of 0.15 · 117 mm average annual rainfall.
County pages carry the local detail — land area, climate normals and the heating and cooling pressures on the ground in each county.
More plain-language help: the TempReach USA heating & cooling guides
TempReach USA routes your call to an independent local heating and cooling professional serving Riverside–San Bernardino — the assessment and the work are theirs.
Call center hours: Mon-Fri 7:00 AM-10:00 PM ET | Sat 8:00 AM-10:00 PM ET | Sun 7:00 AM-9:00 PM ET