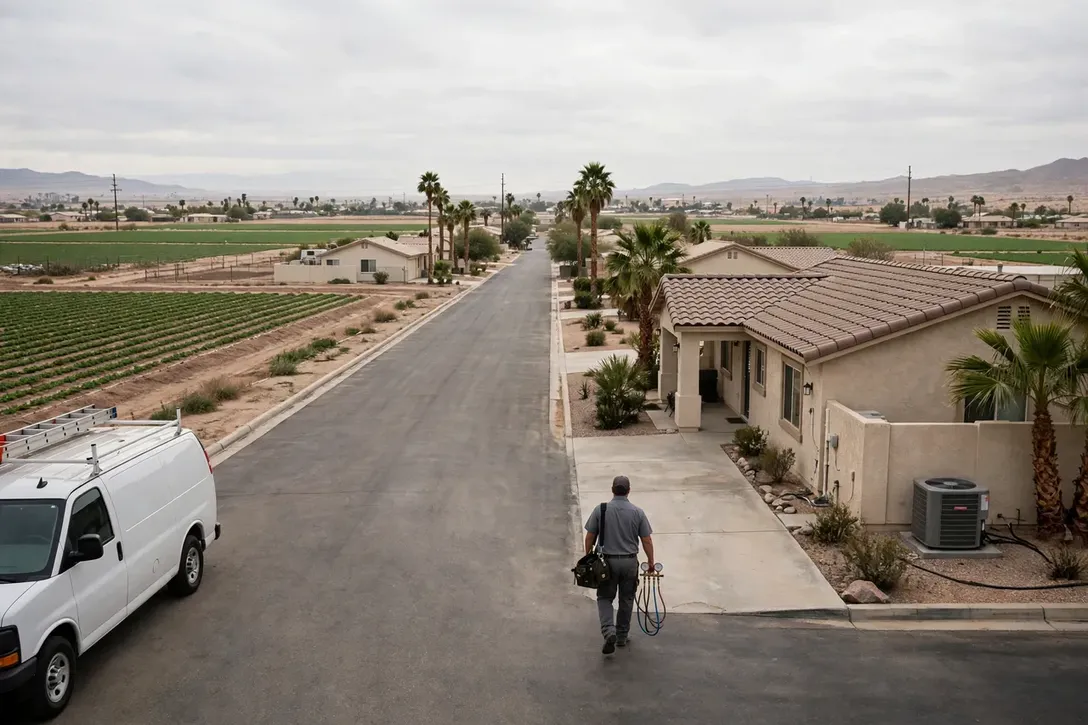


This is El Centro's heating and cooling page, built from El Centro's own numbers: Census housing figures, the metro's ZIP codes and its NOAA climate record. TempReach USA routes your call to an independent local HVAC technician; the homework below is here so you know your home's likely problems before you ever make it.
Call center hours: Mon-Fri 7:00 AM-10:00 PM ET | Sat 8:00 AM-10:00 PM ET | Sun 7:00 AM-9:00 PM ET
The median El Centro home was built in 1988; 39.1% of the stock predates 1980, and the pattern this metro's own data ranks first is air conditioners overworked by extreme heat. TempReach USA is a referral service, not an HVAC company: one call connects you with an independent local HVAC technician serving your ZIP code.
El Centro is a metro of 179,319 people and 48,844 households, and its heating and cooling is a portrait of its building history. The median home here was built in 1988; 39.1% of homes predate 1980 and 15.4% predate 1960, while 29.8% have arrived since 2000. Every one of those eras heated and cooled differently — different furnaces, different duct designs, different refrigerant generations — and they fail differently, which is why this page is organised around the patterns the data actually produces in El Centro rather than HVAC in the abstract.
There is an equipment timeline buried in El Centro's housing figures, and it reads like a technician's diary. The 8,857 homes from before 1960 were heated first and cooled later, their ducts added around floor plans that never imagined them. The 13,630 that followed between 1960 and 1979 mixed those retrofits with the first planned central systems. Then came the 17,886 homes of 1980-1999, fitted with matched systems as standard. Each band of that timeline is now a band of characteristic failures, arriving in the order the equipment tires — which is why a home's build year, in this metro, is the single most predictive fact about its heating and cooling.
The growth side of the metro tells the opposite story in the same language. Calexico, Brawley and the subdivisions still filling in account for much of the 17,138 homes built since 2000 — matched systems, planned ductwork, heat pumps where the lots suit them. Their HVAC is not old; it is uniform, which creates its own calendar: everything installed in the same boom reaches each wear point in the same years, from the first condenser replacements to the first control-board failures, while 4,162 cooling degree days of annual heat keep demand on the system high.
One more record sits over the whole metro, and it is the one the equipment itself keeps: the weather's. IMPERIAL CO AP, CA US logs 2.38 inches of precipitation in an average year and swings between 181.1 days at 90 degrees or more and 4.1 nights at or below freezing. Heating systems ride that swing in their run hours; cooling systems ride it in their cycle counts; ducts ride it in the attics, expanding and contracting between the seasons. Cross the swing with the housing ages above and the selection of problems further down this page stops looking like a list and starts looking like an arithmetic result.
Housing eras and climate, joined — the two datasets every section of this page is built from.
Lay the eras side by side instead: 15.4% pre-1960 (8,857 homes), 23.7% from 1960-1979 (13,630), 31.1% from 1980-1999 (17,886), and 29.8% since 2000 (17,138). No single era tells the story — the proportions among them do, and those proportions are different in every metro this site covers.
Homes from 1980 to 1999 form El Centro's largest band, and they set its HVAC agenda: ducted systems entering their middle age, first-generation high-efficiency furnaces wearing toward their verdicts, condensers on refrigerant generations now in phase-down, thermostats from the first programmable era. It is a stock past its carefree decades and into its maintenance decades — the era where watched systems keep lasting and unwatched ones start presenting their accounts in the form of breakdowns.
Behind the leading era, the growth band: 29.8% of homes arrived since 2000. Their systems are uniform by construction — one generation of equipment, one approach to duct design — which writes a shared calendar the whole street keeps. Reading that calendar early is most of what separates a planned replacement from a weekend emergency in El Centro's newest districts.
Translate the climate record into HVAC terms and it comes out as three working conditions. Condition one, the freeze count — 4.1 nights a year when a heating failure stops being a comfort issue and becomes a household one. Condition two, the heat count — 181.1 days that load condensers, ducts and tempers simultaneously. Condition three, the moisture: 2.38 inches of precipitation arriving as humidity the cooling coil must remove. El Centro's systems are engineered, installed and aged inside those three conditions, and their failures carry the conditions' fingerprints.
That is the whole method of this page in one section: era shares from the Census, loads from NOAA, and a problem list that is simply where the two overlap most in El Centro. The services and guidance that follow are ordered by the same profile — local first, generic last.
Listed in the order this metro's housing and climate data supports.
Age informs an AC repair decision without deciding it — a sound system with a failed motor earns its repair, and an honest diagnosis in El Centro will tell you which side of that line your unit stands on.
Air conditioning in El Centro works against the local calendar: 4,162 cooling degree days a year at IMPERIAL CO AP, CA US, with 181.1 days at 90 degrees or more. The failures follow that load — capacitors and contactors worn by relentless summer cycling, refrigerant charges drifting low on systems that have served a decade of heat, condensate drains clogging in the humid weeks. The older districts run the oldest condensers; the subdivisions around El Centro run matched fleets installed in the same seasons, and both sides of the metro meet the repair call on the hottest week of the year. It is why two El Centro homes of the same age, on different streets, so often need the same visit in the same year.
The local caseload behind this service is written in the climate figures: 4,162 cooling degree days a year and 181.1 days at 90 or above, pressing on a cooling fleet whose oldest members serve the 22,487 pre-1980 homes — in Calexico (38,476 residents) as much as in the oldest districts.
Post-renovation is the clearest case in the trade. Drywall dust and sanding residue settle through every open register, and one thorough cleaning after the work ends removes in hours what the system would otherwise circulate for years.
A word on timing, since El Centro households ask: duct cleaning earns its appointment when the evidence calls for it — after construction or renovation dust, when a home changes hands after years of one household's accumulation, when the registers show visible load or the blower compartment tells the story. Booked on evidence, it is honest work with visible results. Booked on a calendar superstition, it is a van ride. Local technicians who work from the evidence are the ones this page's routing favours, in El Centro and across the metro alike. Ask in Imperial and the answer rhymes with El Centro: same eras, same equipment generations, same calendar of failures.
Duct demand concentrates in the metro's long-biography homes: 22,487 pre-1980 systems that have carried decades of household air, and the renovated homes around Imperial (20,943 residents) whose construction dust is still in the runs.
Across Imperial, the housing split decides the starting point: older, leakier homes around El Centro usually need filtration and moisture work first, while tighter newer builds in the 15 covered ZIP codes usually need deliberate ventilation most.
Ductless installation in El Centro is surveyed room by room across Imperial: the independent local professional calculates each space's load, plans line and drain routes, and quotes the complete design before work begins.
With a median build year of 1988, many El Centro systems are reaching replacement age together; the professional you are connected with inspects ducts and electrics across 15 ZIP codes before recommending equipment.
Across 15 ZIP codes, El Centro heating stock reflects a median build year of 1988 — furnaces at every age, each diagnosed on its own sequence and condition rather than its birthday.
With 57,511 homes and a median build year of 1988, El Centro heating stock spans every era of furnace and flue — each installation assessed on its own house, not on the outgoing unit's label.
Heat pump services in El Centro test the whole year-round system: the independent local professional covering Imperial reads charge and airflow in both modes, proves defrost, and checks auxiliary heat logic before quoting any work.
Across Imperial, one climate fact shapes the configuration: 966 heating degree days against 4,162 cooling degree days tells whether the control's year is mostly a heating story, mostly a cooling story, or a genuine heat pump balancing act.
From the oldest housing in El Centro to the newest subdivisions in its 15 covered ZIP codes, the tune-up's question is identical and local at once: what do this system's measurements say, this season, before the weather asks it anything hard?
Across Imperial, the local professional who answers knows the stock — a median build year of 1988 across 57,511 homes means systems of every age failing in their characteristic ways, from El Centro to the metro's newest subdivisions.
El Centro's commercial buildings span every era around a median build year of 1988 — and with the era goes the equipment, from aging single units over old storefronts to multi-zone systems in new developments, all serviced from a per-unit record.
Ask where this metro's HVAC diary fills up and the answer is a short story: Air conditioners overworked by extreme heat first, the refrigerant transition reaching older systems close behind, and the services that answer them doing the bulk of the booked work. Everything else on the list above is the supporting cast — necessary, frequent enough, but not what El Centro's housing stock, at its age and in its climate, principally demands. Read the service list as a weather report for the metro's systems and it stops looking like a catalogue.
Chosen by this metro's own housing and weather data — the same two records this whole page is built from.
Ask what extreme heat breaks first and the honest answer is: whatever was already closest to the edge. In El Centro that is usually an electrical part rather than the compressor itself — a capacitor swollen by heat and hard starts, a contactor whose points have pitted through seasons of cycling, a condenser fan motor running hot in still air. The pattern shows in the timing: failures at the hottest hour, systems that restart after cooling down, cooling that fades as the afternoon builds. Those are load symptoms, and they point a technician toward the outdoor unit and its electrical cabinet before anything indoors. Homes around El Centro and across the metro share the pattern because they share the weather; the age of the unit decides which home the heat collects from first.
Households tend to judge a cooling system by its mildest day. On a mild day an overworked system still copes, still reaches the setting, still argues for another season. Judge it by its hottest week instead: the hours it ran without pausing, the afternoons the house drifted upward, the nights it needed to recover. In El Centro, IMPERIAL CO AP, CA US keeps the honest record of that week — 181.1 days a year over 90 degrees is the examination the system actually sits. The homes that fare well in it are rarely the ones with the newest equipment; they are the ones whose owners believed the early chapters of the strain story — the lengthening runs, the fading afternoons — and had the wear items checked while the system was still arguing its case.
The climate record makes the pattern's case on its own: 181.1 days a year at 90 degrees or more at IMPERIAL CO AP, CA US, stacked into a season of 4,162 cooling degree days. Every system in El Centro sits that examination; the ones that fail it are the ones whose wear items were already spent when the heat arrived.
Planning is where households regain the advantage. A El Centro homeowner who knows their system's refrigerant, age and repair history can run the transition on their own schedule: service the current machine properly, watch the leak-and-wear indicators, and time any replacement for a shoulder season, chosen equipment and an unhurried installation. The homeowner who meets the transition for the first time through a breakdown meets it on the calendar's worst terms — mid-heat, limited deliberation, a decision between an expensive charge on an old machine and a replacement nobody had budgeted to choose that week. The transition itself is the same in both stories; the difference is purely when the household chose to read the nameplate. Technicians in this metro can recite both versions from memory, street by street, because the metro's equipment generations were installed street by street.
A transition-aware service visit has a recognizable order. First, identification: the nameplate's refrigerant, model and year, stated aloud so the household and technician share the fact. Second, the leak question, taken seriously — a system low on charge has a leak until proven otherwise, and recharging without finding it is buying the same refrigerant twice on an installment plan. Third, the condition audit around the failure: compressor health, coil condition, electrical wear, because the decision the household faces is about the whole machine, not the one part that stopped. Fourth, the comparison itself, presented as what it is — the repair path with its realistic horizon, the replacement path with its — so the choice is made on the machine's merits and the household's plans for the home. In El Centro that conversation, held in a calm season, is unhurried and genuinely optional-feeling; held in a heat wave, the same facts arrive wearing a deadline.
The regulatory facts are the foundation: R-22 production and import ended in the United States in 2020, leaving reclaimed stock as the supply, while new equipment has moved through R-410A to the current lower-impact generation. In El Centro every generation still stands in service — the transition is not coming to this metro; it is distributed across it, yard by yard.
Duct loss hides inside other complaints. It presents as an air conditioner that cannot keep up in July — because the supply run through the attic is delivering air that picked up heat the whole way there. It presents as dust that returns days after cleaning, drawn in through return leaks in the crawl space. It presents as a furnace that heats the basement ceiling handsomely and the bedrooms modestly. In El Centro, where many homes route their ducts outside the conditioned envelope by design of their era, these presentations are common enough to have a standing place in a technician's first questions. Separating duct loss from equipment weakness takes measurement rather than opinion — pressures and temperatures at the registers compared with those at the unit — and the separation matters, because the remedies are entirely different and only one of them touches the actual loss.
Read a duct system the way a technician does and the examination has a shape: start at the air handler and work outward. At the plenum, connections are inspected where they are most stressed and most consequential. Along the runs, the checks are for the known failure family — separated joints, fallen insulation, sagging flex, crushed sections, takeoffs that were sealed with hope rather than mastic. At the registers, temperatures and airflow are compared room by room, and the map of strong and weak rooms is laid over the map of the runs themselves; the two maps explain each other with remarkable consistency. Returns get the same walk, with attention to panned cavities and any path that lets the system breathe from outside the envelope. Cleaning belongs in this picture where the inspection finds accumulation — but cleaning a leaking network without sealing it polishes the inside of a system that is losing its cargo through the walls.
The load figures complete the case: 4,162 cooling degree days and 966 heating degree days at IMPERIAL CO AP, CA US mean the network is in service in earnest at both ends of the year. Duct loss here is not a summer inefficiency or a winter one; it is a twelve-month tax on a system that works both seasons.
The season does not need to be survived in one heroic effort; it needs to be read in chapters. Early heat exposes weak starting parts. The long middle stretch exposes capacity — systems sized or charged marginally fall behind a degree at a time while running without pause. The humid weeks expose drainage, as condensate runs at full volume and a slowing drain announces itself. Late season exposes fatigue, when components worn by months of starts begin to fail on ordinary days. Between chapters, the household's work is mostly attention: a filter's condition, a drain's flow, the sound of a startup, the temperature at a far register. The season is the metro's longest HVAC fact — 4,162 cooling degree days of it — and it rewards the households that pace their systems through it instead of discovering it all at once.
The season loads El Centro's systems the way its record at IMPERIAL CO AP, CA US says it will: 966 heating degree days against 4,162 cooling degree days in an average year, against a housing stock whose median build year is 1988. The households that read the season early — filters, drains, a system run before the extreme weeks — are the ones whose calls stay schedulable.
The deep structure of heat failure in El Centro is generational. Equipment installed in the same building boom ages on the same schedule, so whole streets approach the wear limits of their starting components together. The climate record at IMPERIAL CO AP, CA US supplies the trigger — the season's hottest stretch — and the housing record supplies the candidates: the 22,487 pre-1980 homes whose systems have been replaced at least once already, and the newer stock whose first systems are arriving at the same age simultaneously. Neither record alone predicts the call map; read together, they predict it street by street. That is why local experience in this metro is genuinely local knowledge: the technician who has worked its booms knows which generation of equipment each district is spending this summer.
Strip the pattern down to its inputs and the ranking stops being mysterious: 48,844 households depending on systems installed across a median build year of 1988, in a climate that swings between 181.1 days of serious heat and 4.1 freezing nights. Whatever pattern a metro with those inputs manufactures most, it manufactures here — the lead position is less a title than a consequence, recalculated from the same public records any sceptic can check.
The first visit follows a short, diagnostic list — each item ruling a branch of the problem in or out:
PROBLEM SOLUTION
Population 44,186
Population 38,476
Population 26,934
Population 20,943
Population 7,308
Population 6,549
Population 6,244
Population 5,606
Population 1,734
Population 1,654
Population 1,388
Population 497
Also in the El Centro metro: El Prado Estates (population 390), Bombay Beach (population 313).
Beyond El Centro itself, the metro takes in Calexico (38,476 residents), Brawley (26,934) and the rest of the communities in the grid above — each fitted with heating and cooling in its own building era, which is why two streets in the same metro can need entirely different HVAC conversations. The ZIP list below is the full coverage footprint: if your code is on it, this page was written about your housing stock.
The map continues: Imperial (20,943), Heber (7,308), Calipatria (6,549), Salton City (6,244), Holtville (5,606). Different names, different decades — each community in Imperial was fitted with heating and cooling in its own growth years, which is why two streets in the same metro can need entirely different HVAC conversations. The ZIP list below is the working definition of coverage; the housing behind each code is the working definition of the job.
The metro's weight is not evenly spread. El Centro holds 44,186 of the 179,319 residents; Calexico and Brawley add 38,476 and 26,934; and the remainder scatters across the smaller places above, some no bigger than a few thousand people. HVAC follows the weight — most calls come from where most homes are — but era matters more than size: a small community of 1960s housing generates older-system work than a large new subdivision does.
Administratively the metro is drawn from Imperial — 1 in all — with Imperial County at its centre. County lines do not change how a system runs, but they do shape the paperwork around the work: permits, inspections and code details are county and city business, which is one reason the professional who serves your street is a local one.
This page ends at the metro boundary, but the region does not: San Diego, CA, Riverside–San Bernardino, CA and Los Angeles, CA continue the coverage in their own directions, each with a profile built from its own Census and NOAA figures. If your home sits near the line between metros, go by your ZIP code — it places you in the dataset that describes your housing.
Set El Centro among its neighbours and the contrasts sharpen the profile: San Diego, CA — metro population 3,282,248, median build year 1980 — sits 82 miles away; Riverside–San Bernardino, CA (4,769,007, median 1986) 96 miles; Los Angeles, CA (12,844,441, median 1969) 166 miles. Three different housing stocks under three nearby skies, which is why each keeps its own page and its own problem ranking rather than borrowing this one.
The stock has a shape as well as a size. Owners hold 56.8% of it and renters 43.2%, a split that decides who notices a comfort problem first and who arranges the repair. The generations split 1.3-to-one in favour of the pre-1980 homes. And the map divides into 14 named communities across Imperial, each carrying its era's share of the 57,511 housing units the Census counts here.
El Centro by the derived numbers — median home age 38 years · owners in 27,743 homes, renters in 21,101 · each covered ZIP code carrying about 590 pre-1960 homes · a heating-to-cooling degree-day ratio of 0.23 · 60 mm average annual rainfall.
County pages carry the local detail — land area, climate normals and the heating and cooling pressures on the ground in each county.
More plain-language help: the TempReach USA heating & cooling guides
One call connects you with an independent local heating and cooling professional serving El Centro and the surrounding metro.
Call center hours: Mon-Fri 7:00 AM-10:00 PM ET | Sat 8:00 AM-10:00 PM ET | Sun 7:00 AM-9:00 PM ET