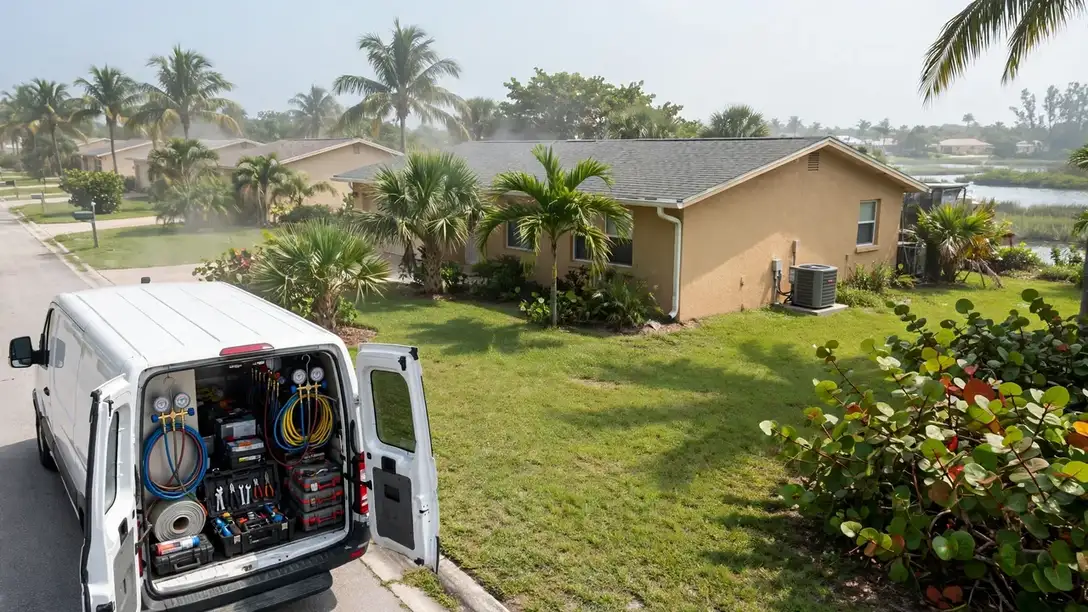


Everything on this page was computed for Palm Bay–Melbourne and nowhere else: the problem ranking from its Census housing profile, the seasonal risks from its NOAA station record, the coverage from its own ZIP codes. TempReach USA connects you to an independent local HVAC technician; the page itself is the homework, done in public, so the call you make is an informed one.
Call center hours: Mon-Fri 7:00 AM-10:00 PM ET | Sat 8:00 AM-10:00 PM ET | Sun 7:00 AM-9:00 PM ET
The median Palm Bay–Melbourne home was built in 1987; 33.1% of the stock predates 1980, and the pattern this metro's own data ranks first is humidity burden on homes and cooling systems. TempReach USA is a referral service, not an HVAC company: one call connects you with an independent local HVAC technician serving your ZIP code.
Start with the raw material: 620,533 people, 294,461 housing units, and a housing stock whose middle home was built in 1987. That single date organises everything on this page. On one side of it stand the older districts — 7.7% of homes predate 1960, 33.1% predate 1980 — heated and cooled by systems renewed in pieces for decades, in homes across Brevard. On the other side, the 27.9% built since 2000 run matched modern equipment, and fail in the newer ways. A Palm Bay–Melbourne technician reads a home's build year the way a doctor reads a chart: it predicts, before a single panel is opened, which systems deserve suspicion first.
The pre-1980 stock is where most of the metro's HVAC character lives. Homes from those decades in Brevard County and across Brevard were built with duct layouts from the first age of central systems, furnaces and condensers that have since been renewed piecemeal, and insulation standards from another era, and each of those choices is now at or beyond the age its makers expected of it. Owner-occupiers hold 76.9% of the metro's homes, so most of the people reading this page are reading about a system they own outright — one whose failures arrive as surprises only if nobody has looked at the pattern: cooling fading a little each summer, a furnace recovering a little more slowly, one room drifting a little further from the thermostat.
The growth side of the metro tells the opposite story in the same language. Melbourne, Titusville and the subdivisions still filling in account for much of the 82,155 homes built since 2000 — matched systems, planned ductwork, heat pumps where the lots suit them. Their HVAC is not old; it is uniform, which creates its own calendar: everything installed in the same boom reaches each wear point in the same years, from the first condenser replacements to the first control-board failures, while 3,446 cooling degree days of annual heat keep demand on the system high.
The climate written over all of it comes from the NOAA station at MELBOURNE INTL AP, FL US: an average year brings 485 heating degree days, 3,446 cooling degree days and 50.79 inches of precipitation. Those are not abstractions to a furnace or a condenser — they set how many hours a heating system runs each winter, how hard a cooling system cycles in July, and how much moisture every coil has to pull out of the indoor air. The problem sections that follow are selected by exactly these numbers, combined with the housing-age profile above.
Two public records, one metro: what was built here, and what the sky does to it.
Break the stock down by building era and the profile sharpens. Before 1960: 7.7% of homes, roughly 22,673 of them. From 1960 to 1979: 25.4%, about 74,793. From 1980 to 1999: 39.1%, about 115,134. Since 2000: 27.9%, about 82,155. Four eras, four equipment generations — and the balance among them is this metro's HVAC character in a single paragraph.
The metro's HVAC present was installed between 1980 and 1999, and it is ageing as a cohort. That cohort's traits are consistent: sound bones, wearing surfaces. The systems beneath these homes are not failing from ancient design but from the accumulated cycles of two to four decades — and the work they generate is the steady, schedulable kind, provided it is scheduled. Left alone, cohort ageing has a way of arriving all at once; attended to, it is the most manageable profile a metro can have.
Behind the leading era, the growth band: 27.9% of homes arrived since 2000. Their systems are uniform by construction — one generation of equipment, one approach to duct design — which writes a shared calendar the whole street keeps. Reading that calendar early is most of what separates a planned replacement from a weekend emergency in Palm Bay–Melbourne's newest districts.
Translate the climate record into HVAC terms and it comes out as three working conditions. Condition one, the freeze count — 1.8 nights a year when a heating failure stops being a comfort issue and becomes a household one. Condition two, the heat count — 62.8 days that load condensers, ducts and tempers simultaneously. Condition three, the moisture: 50.79 inches of precipitation arriving as humidity the cooling coil must remove. Palm Bay–Melbourne's systems are engineered, installed and aged inside those three conditions, and their failures carry the conditions' fingerprints.
That is the whole method of this page in one section: era shares from the Census, loads from NOAA, and a problem list that is simply where the two overlap most in Palm Bay–Melbourne. The services and guidance that follow are ordered by the same profile — local first, generic last.
Sequenced by this metro's own problem ranking, not by a national catalogue order.
Tight houses need deliberate breathing. A ventilator exchanges stale air for fresh while recovering energy between the streams — the managed version of what leaky construction used to do by accident, with filtration on the intake.
Indoor air in Palm Bay–Melbourne is a two-season problem. The hot season — 62.8 days at 90 or above — seals homes shut around their air conditioning, and whatever the system recirculates stays in circulation: pollen tracked in during the green months, humidity the coil cannot fully pull down, the ordinary chemistry of a lived-in house. The cold season seals homes the other way, around their heating. Air quality work — filtration, humidity control, ventilation, purification — is sized to that sealed-house reality and to the housing: older homes leak air freely, newer ones hold it tightly, and the remedies differ. With a median build year of 1987, most of the metro's 294,461 housing units are working through the same ageing curve.
Air quality demand in this metro is written by its sealed seasons: 62.8 hot days with the windows shut around the cooling, 1.8 freezing nights with them shut around the heat. The 82,155 post-2000 homes hold their air tightest; the older districts around Melbourne exchange theirs with attics and crawl spaces.
Ice on the line, a tripping breaker, run times that lengthen week by week — in Palm Bay–Melbourne these are the early chapters of a cooling failure, and a diagnosis caught at that stage is usually a component, not a system.
One more pattern belongs in the Palm Bay–Melbourne picture: repair calls here are also a refrigerant story. Systems fitted in the older decades run on refrigerant generations the industry has been retiring, and every repair on those units weighs the charge's scarcity against the system's remaining life. The technician who explains that arithmetic plainly — what the repair restores, what it cannot assure anyone about next summer — is giving the household the real choice, and in the 97,467 pre-1980 homes it is a conversation held weekly. Ask in Merritt Island and the answer rhymes with Palm Bay: same eras, same equipment generations, same calendar of failures.
The local caseload behind this service is written in the climate figures: 3,446 cooling degree days a year and 62.8 days at 90 or above, pressing on a cooling fleet whose oldest members serve the 97,467 pre-1980 homes — in Merritt Island (34,718 residents) as much as in the oldest districts.
Post-renovation is the clearest case in the trade. Drywall dust and sanding residue settle through every open register, and one thorough cleaning after the work ends removes in hours what the system would otherwise circulate for years.
Duct cleaning in Palm Bay–Melbourne is booked in waves that follow the housing: after the renovation seasons in the older districts, at move-in across the subdivisions, alongside system replacements everywhere. The work pairs naturally with the inspection that surrounds it — leaking joints found and sealed, a disconnected run in an attic discovered, insulation fallen where it should not be. The cleaning is the appointment; the findings are often the value. The 50.79 inches of rain in an average year here is part of the story too — humidity loads every cooling coil in the metro.
Count the systems and the diary fills itself: 251,889 households breathing through ductwork daily, the oldest of it in homes from the 1980s and the newest in the subdivisions past West Melbourne. What the cleaning finds follows the biography — dust in proportion to years, debris in proportion to renovations.
Ductless installation in Palm Bay–Melbourne is surveyed room by room across Brevard: the independent local professional calculates each space's load, plans line and drain routes, and quotes the complete design before work begins.
With a median build year of 1987, many Palm Bay–Melbourne systems are reaching replacement age together; the professional you are connected with inspects ducts and electrics across 30 ZIP codes before recommending equipment.
From Palm Bay to Merritt Island, a no-heat call through TempReach USA reaches a local professional whose visit includes the exchanger and venting checks that furnace work owes a Palm Bay–Melbourne household.
Heating installation in Palm Bay–Melbourne starts with a heat-loss calculation across Brevard: the independent local professional measures the home's loss, inspects ducts and venting, and quotes the full scope before work begins.
Across 30 ZIP codes and housing from a median build year of 1987, Palm Bay–Melbourne heat pumps are specified and serviced from heat-loss figures and low-temperature performance data, not nominal tonnage.
From Palm Bay to the metro's edge, Palm Bay–Melbourne's 294,461 homes run every system type there is — single-stage furnaces, two-stage equipment, heat pumps with auxiliary heat — and each gets a control matched to its terminals, not a shelf guess.
Across Brevard, the service record is the scarcest asset: with a median build year of 1987 across 294,461 homes, many systems around Palm Bay have no documented history — and a first tune-up's baseline is what every later decision stands on.
Across Brevard, the local professional who answers knows the stock — a median build year of 1987 across 294,461 homes means systems of every age failing in their characteristic ways, from Palm Bay to the metro's newest subdivisions.
In Palm Bay–Melbourne, commercial work follows the stock: 294,461 housing units' worth of mixed buildings — offices, retail and restaurants from Palm Bay across the 30 covered ZIP codes — each with rooftop units whose service rhythm the local professional sets per building.
If this page's services were ranked by Palm Bay–Melbourne's call patterns rather than listed in catalogue order, they would come out much as they do here — because the ranking behind them is data, not habit. Humidity burden on homes and cooling systems leads the metro's problem table and the refrigerant transition reaching older systems follows, so the services answering them lead the list. The long tail of a metro's HVAC life — thermostat calls, duct questions, the one room that never matches the rest — fills in the diary around them, here as everywhere.
Selected and ranked from this metro's housing-age profile and climate record — not copied from another city's page.
Ask where a home's humidity actually comes from and the answers are a census of ordinary life: showers, cooking, laundry, breathing, houseplants, a damp crawl space exhaling through the floor, rain finding the grade against the foundation. In Palm Bay–Melbourne the outdoor air itself joins the census for much of the year, entering through every leak in the envelope and every return-duct path that crosses a humid space. The air conditioner is expected to process the sum of it. That expectation is reasonable only when the system's drying capacity is matched to the load — and the load is a property of the house and its climate together, which is why two identical systems on the same street can leave one house crisp and another sticky: the houses are importing different amounts of water, and only one system's setup accounts for it.
Working a humidity complaint follows the water. The first measurements are indoor: relative humidity readings in several rooms, at several times, since a single reading at the thermostat flatters the story. The second look is at the equipment's drying setup — system size against the home's actual load, airflow across the coil, cycle length on a typical afternoon, and the condensate drain's condition and output. The third look is at the sources: crawl space or basement moisture, bathroom and kitchen exhausts that vent into attics instead of outdoors, plumbing weeping quietly somewhere, grade and gutters delivering rainwater to the foundation. Only then does the remedy conversation make sense, because each layer has its own remedy — equipment setup, dedicated dehumidification, ventilation correction, source control — and prescribing from one layer for a problem living in another is how humidity complaints survive multiple service visits.
The precipitation record testifies first: 50.79 inches of rain in an average year at MELBOURNE INTL AP, FL US means Palm Bay–Melbourne's air arrives wet for much of the season, and every cooling system in the metro is a dehumidifier by necessity, whether its setup honors the role or not.
Planning is where households regain the advantage. A Palm Bay–Melbourne homeowner who knows their system's refrigerant, age and repair history can run the transition on their own schedule: service the current machine properly, watch the leak-and-wear indicators, and time any replacement for a shoulder season, chosen equipment and an unhurried installation. The homeowner who meets the transition for the first time through a breakdown meets it on the calendar's worst terms — mid-heat, limited deliberation, a decision between an expensive charge on an old machine and a replacement nobody had budgeted to choose that week. The transition itself is the same in both stories; the difference is purely when the household chose to read the nameplate. Technicians in this metro can recite both versions from memory, street by street, because the metro's equipment generations were installed street by street.
The mechanics underneath the policy are simple. A refrigerant is the working fluid of the cooling cycle: it evaporates indoors to absorb heat and condenses outdoors to release it, thousands of times a season. Each generation of fluid was engineered to improve on the last one's environmental profile and operating pressures, and each required its own hardware — compressors built for different pressures, oils that mix with one fluid and not another, metering set for one fluid's characteristics. That is why the generations cannot be swapped like brands of the same product, and why 'topping up' an older system always means its own fluid, sourced from whatever supply its generation still commands. In Palm Bay–Melbourne, where systems from all three generations stand in neighboring yards, the diversity is a service reality: diagnosis begins with identification, because the same symptom — a system low on charge — carries three different expense structures depending on the nameplate.
Count the generations the way a technician's route does: a single Palm Bay–Melbourne street can hold an R-22 veteran, two R-410A systems and a current-generation installation within a few doors. The service records of one metro contain the whole transition — which is why identification, not assumption, opens every diagnosis here.
There is a particular sound to a heat-stressed system: the outdoor unit starts, labors, and settles into a run that does not end. In Palm Bay–Melbourne, where 3,446 cooling degree days stack the season's demand into long hot weeks, that endless run is the system telling the household its margin is gone. It may still be cooling — that is the trap. A unit can hold a house five degrees above the set point for days while spending its components to do it, and the repair that eventually follows is dated from when the margin ran out, not from when the cooling stopped. Reading the run time is therefore part of the diagnosis: a technician asks not only what failed, but how long the house had been asking for more than the system had left.
Households tend to judge a cooling system by its mildest day. On a mild day an overworked system still copes, still reaches the setting, still argues for another season. Judge it by its hottest week instead: the hours it ran without pausing, the afternoons the house drifted upward, the nights it needed to recover. In Palm Bay–Melbourne, MELBOURNE INTL AP, FL US keeps the honest record of that week — 62.8 days a year over 90 degrees is the examination the system actually sits. The homes that fare well in it are rarely the ones with the newest equipment; they are the ones whose owners believed the early chapters of the strain story — the lengthening runs, the fading afternoons — and had the wear items checked while the system was still arguing its case.
Read Palm Bay–Melbourne's housing and weather together and the strain stops looking random: a median build year of 1987 means much of the metro's cooling equipment is deep into its working life, and the heat at MELBOURNE INTL AP, FL US asks the oldest systems for the longest runs of the year.
Renovation writes its own chapter in this pattern. Homes in Palm Bay–Melbourne have been extended, finished and re-divided for decades — a garage converted, a basement finished, an addition tied into ductwork sized for the original house. Each alteration borrows air from the existing network, and the borrowing is rarely repaid with new capacity or rebalanced runs. The result is a duct system whose map no longer matches the house it serves: original rooms over-supplied, added rooms fed by a hopeful tap into a trunk that was never asked to carry them. Add the slow leaks of age on top of the redesigns of renovation, and the far rooms' complaints stop being mysterious. The remedy starts with honesty about the map — what was designed, what was improvised, and what each run can actually deliver — before any cleaning, sealing or resizing is worth doing.
The construction details explain the timeline. Duct joints are mechanical connections, and the sealants asked to make them permanent have finite lives: cloth-backed tape dries and releases, foil tape lifts at edges, and even mastic can crack where runs move with the building. Flex duct, common in the metro's later building decades, fails at its connections and where its inner liner is pierced or crushed — and a crushed section quietly throttles every room downstream of it. Meanwhile the spaces the ducts cross work against them: attic temperatures in a Palm Bay–Melbourne summer turn an uninsulated or leaking run into a heat exchanger pointed the wrong way, and winter reverses the argument in the crawl space. A duct system is therefore not a fixed asset but a slowly changing one, and its delivered performance in any given year is an empirical question, not a memory of its installation day.
Consider the delivery assumption: every system in Palm Bay–Melbourne was sized on the expectation that its air would arrive. With 33.1% of homes built before 1980 — and their networks renovated, extended and re-sealed by turns ever since — that expectation's reliability varies house by house, which is why the measurement, not the assumption, has to govern.
What the humid months examine is the difference between a house and a sealed jar of wet air. Palm Bay–Melbourne's 50.79 inches of average rain arrive unevenly, and the saturated stretches hold indoor moisture high against every system's ability to remove it. The evidence surfaces politely first — a closet's musty note, a mirror that clears slowly, registers that sweat on the most saturated afternoons — long before it surfaces as a breakdown or a mold conversation, which is why this season rewards the households that read the polite version. The tools are unglamorous: measured indoor humidity, a drain that flows, cycles long enough to dry, and moisture sources answered at the source rather than at the thermostat.
The season loads Palm Bay–Melbourne's systems the way its record at MELBOURNE INTL AP, FL US says it will: 485 heating degree days against 3,446 cooling degree days in an average year, against a housing stock whose median build year is 1987. The households that read the season early — filters, drains, a system run before the extreme weeks — are the ones whose calls stay schedulable.
The burden has an address pattern in Palm Bay–Melbourne, and it follows water's own map. The low ground and the older districts — the streets around Palm Bay and the housing that grew before modern drainage and vapor standards — carry the metro's dampest houses: crawl spaces close to grade, foundations that have managed a century of rain, ductwork running through the wettest air in the home. The 97,467 pre-1980 homes concentrate these conditions, and their cooling systems inherit a drying load that newer construction on higher, drier detailing simply does not present. Add the climate's own delivery — the wet season pressing in through every envelope leak — and the humidity map of the metro is drawn twice over, once by its terrain and once by its building history. Technicians who work the map know which neighborhoods' calls will mention the smell, the sweating registers and the sticky rooms before the homeowner finishes the sentence.
Read the ranking backwards and it reads as a data summary: 620,533 residents in 294,461 housing units, 7.7% of the housing from before 1960, 50.79 inches of rain in an average year. The pattern leads because the exposure is broad — counted not in individual unlucky houses but in whole eras of the metro's building, stacked one on another.
Experienced local practice starts with the simple certainties — the observations that take minutes and decide the most:
PROBLEM SOLUTION
Population 125,273
Population 85,718
Population 49,004
Population 34,718
Population 28,279
Population 27,643
Population 24,617
Population 19,330
Population 17,169
Population 13,082
Population 11,341
Population 11,250
Also in the Palm Bay–Melbourne metro: Cape Canaveral (population 9,976), Micco (population 9,053).
Read the grid as a building programme spread over a century. The oldest communities sit where the metro began; the youngest are still adding streets at its edge; and Melbourne and Titusville, with 85,718 and 49,004 residents, stand for the rings in between. Each ring was fitted in its era's equipment, and each is now failing, wearing or holding in its era's characteristic order. The ZIP codes below draw the coverage boundary; the eras inside it draw everything else on this page — the problems ranked, the services ordered, the checks advised.
Also on the Palm Bay–Melbourne map: Merritt Island (34,718), Rockledge (28,279), West Melbourne (27,643), Port St. John (24,617), Cocoa (19,330) — communities spread across Brevard, each with housing from its own growth years. A technician routed through TempReach USA to any of them is working from this same page: the metro data does not change at the city limit, but the housing on your street — its age, its equipment, its attic — is what the visit is really about.
Every metro has a first city and a supporting cast, and the census figures draw the billing plainly here: Palm Bay first, with 125,273 residents; Melbourne second at 85,718; Titusville third at 49,004; then the long tail of smaller communities in the grid above. The billing matters less than the building dates — each of these places was fitted with heating and cooling in its own decade, by its own builders — but between them they account for nearly every housing era, equipment generation and failure pattern this page describes.
Draw the metro by its paperwork and it resolves into Brevard — 1 jurisdictions sharing one housing stock and one weather system. Brevard County holds the historic centre and the densest share of the older homes; the surrounding counties hold the rings of growth around it. Permits and inspections follow those boundaries even though temperature never does, which is part of why the technician this page connects you to works these streets specifically.
Beyond the metro line, the nearest covered metros are Orlando, FL (41 miles away), Sebastian–Vero Beach, FL (42 miles) and Lakeland, FL (65 miles) — separate pages, separate profiles, because their housing and weather records are their own. Homeowners near the boundary sit between two datasets; the ZIP list above, not the map's edge, decides which page was written about your stock.
Set Palm Bay–Melbourne among its neighbours and the contrasts sharpen the profile: Orlando, FL — metro population 2,957,672, median build year 1994 — sits 41 miles away; Sebastian–Vero Beach, FL (172,799, median 1991) 42 miles; Lakeland, FL (874,790, median 1991) 65 miles. Three different housing stocks under three nearby skies, which is why each keeps its own page and its own problem ranking rather than borrowing this one.
Ratios tell the metro's story compactly. Renters occupy 23.1% of homes; owners hold the rest. For every home built since 2000 there are 1.2 from before 1980. Spread the stock across the coverage map and each ZIP code carries about 9,815 housing units — the density at which era patterns repeat street after street instead of scattering, and at which a routed round of calls stays inside a few districts.
One line of Palm Bay–Melbourne arithmetic — a median home 39 years old · 193,703 owner-occupied homes against 58,186 renter-occupied · 756 pre-1960 homes for every covered ZIP code · a heating-to-cooling degree-day ratio of 0.14 · 1,290 mm of rain in an average year.
County pages carry the local detail — land area, climate normals and the heating and cooling pressures on the ground in each county.
More plain-language help: the TempReach USA heating & cooling guides
Describe the problem and the call center routes you to an independent local HVAC technician who works in the Palm Bay–Melbourne metro.
Call center hours: Mon-Fri 7:00 AM-10:00 PM ET | Sat 8:00 AM-10:00 PM ET | Sun 7:00 AM-9:00 PM ET