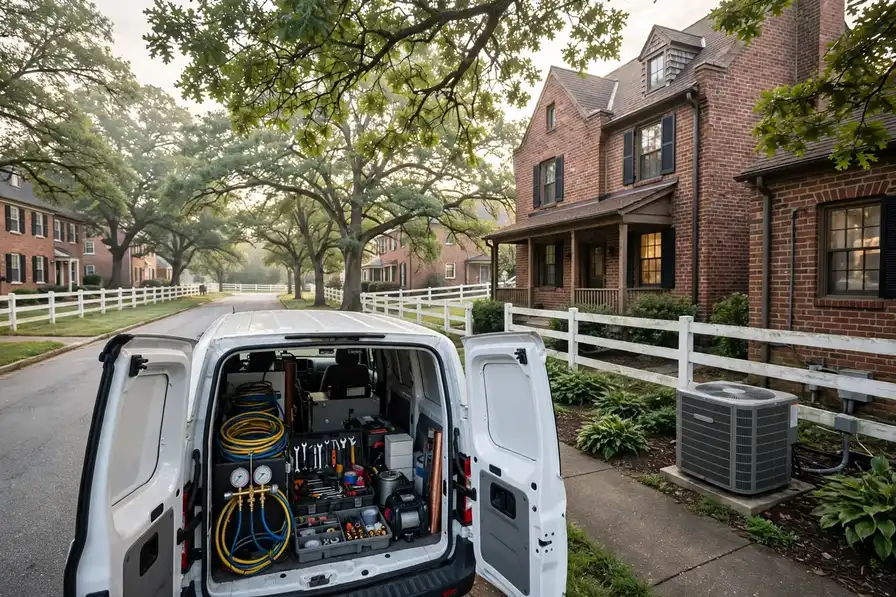


Everything on this page was computed for Lexington and nowhere else: the problem ranking from its Census housing profile, the seasonal risks from its NOAA station record, the coverage from its own ZIP codes. TempReach USA connects you to an independent local HVAC technician; the page itself is the homework, done in public, so the call you make is an informed one.
Call center hours: Mon-Fri 7:00 AM-10:00 PM ET | Sat 8:00 AM-10:00 PM ET | Sun 7:00 AM-9:00 PM ET
The median Lexington home was built in 1985; 42.8% of the stock predates 1980, and the pattern this metro's own data ranks first is the refrigerant transition reaching older systems. TempReach USA is a referral service, not an HVAC company: one call connects you with an independent local HVAC technician serving your ZIP code.
Read Lexington through its counties and the picture sharpens. Bourbon, Clark, Fayette, Jessamine, Scott, Woodford were not built in the same decades or for the same households, and their heating and cooling carries those differences: an older core where 17.7% of the metro's homes predate 1960, growth corridors where the subdivisions arrived in waves, and edges still being built out. The metro-wide medians — a middle home built in 1985, 229,005 housing units in all — are the average of those local stories, and the sections below are organised by the patterns the combined record produces, from the oldest equipment generations to the newest failure modes.
There is an equipment timeline buried in Lexington's housing figures, and it reads like a technician's diary. The 40,534 homes from before 1960 were heated first and cooled later, their ducts added around floor plans that never imagined them. The 57,480 that followed between 1960 and 1979 mixed those retrofits with the first planned central systems. Then came the 68,243 homes of 1980-1999, fitted with matched systems as standard. Each band of that timeline is now a band of characteristic failures, arriving in the order the equipment tires — which is why a home's build year, in this metro, is the single most predictive fact about its heating and cooling.
The growth side of the metro tells the opposite story in the same language. Georgetown, Nicholasville and the subdivisions still filling in account for much of the 62,747 homes built since 2000 — matched systems, planned ductwork, heat pumps where the lots suit them. Their HVAC is not old; it is uniform, which creates its own calendar: everything installed in the same boom reaches each wear point in the same years, from the first condenser replacements to the first control-board failures, while 1,289 cooling degree days of annual heat keep demand on the system high.
The climate written over all of it comes from the NOAA station at LEXINGTON BLUEGRASS AP, KY US: an average year brings 4,432 heating degree days, 1,289 cooling degree days and 49.84 inches of precipitation. Those are not abstractions to a furnace or a condenser — they set how many hours a heating system runs each winter, how hard a cooling system cycles in July, and how much moisture every coil has to pull out of the indoor air. The problem sections that follow are selected by exactly these numbers, combined with the housing-age profile above.
The metro's building eras on one side, its weather record on the other — and its heating and cooling where the two meet.
The distribution, in one breath: of every hundred Lexington homes, 17.7 were standing before 1960, 25.1 went up in the two decades after, 29.8 in the two after that, and 27.4 have arrived since 2000. Percentages flatten the picture, so hold the counts beside them — 40,534 oldest-era homes, 62,747 newest — and the metro's heating and cooling stops being an abstraction: it is that many systems, of those ages, failing in that order.
This metro's stock was mostly built in HVAC's transitional decades, 1980 to 1999, and it shows a particular failure calendar: not the deep-design sagas of the old metros, but the wear-out wave of everything installed in those years arriving together — capacitors, igniters, control boards, the first of the modern systems ageing into their verdicts. Lexington's HVAC story for the next decade is largely written: it is the story of that installed base reaching its limits neighbourhood by neighbourhood.
Behind the leading era, the growth band: 27.4% of homes arrived since 2000. Their systems are uniform by construction — one generation of equipment, one approach to duct design — which writes a shared calendar the whole street keeps. Reading that calendar early is most of what separates a planned replacement from a weekend emergency in Lexington's newest districts.
The climate half of the profile, from LEXINGTON BLUEGRASS AP, KY US: 4,432 heating degree days against 1,289 cooling degree days, 49.84 inches of precipitation, an average temperature of 56.3 degrees. Read together, those figures describe the loads: how many hours a furnace runs in a year, how relentlessly a condenser cycles through summer, how much moisture the cooling coil must pull from the air — 89.9 nights at or below freezing, against 25.1 days at 90 or above.
That is the whole method of this page in one section: era shares from the Census, loads from NOAA, and a problem list that is simply where the two overlap most in Lexington. The services and guidance that follow are ordered by the same profile — local first, generic last.
Chosen by this metro's own housing and weather data — the same two records this whole page is built from.
Planning is where households regain the advantage. A Lexington homeowner who knows their system's refrigerant, age and repair history can run the transition on their own schedule: service the current machine properly, watch the leak-and-wear indicators, and time any replacement for a shoulder season, chosen equipment and an unhurried installation. The homeowner who meets the transition for the first time through a breakdown meets it on the calendar's worst terms — mid-heat, limited deliberation, a decision between an expensive charge on an old machine and a replacement nobody had budgeted to choose that week. The transition itself is the same in both stories; the difference is purely when the household chose to read the nameplate. Technicians in this metro can recite both versions from memory, street by street, because the metro's equipment generations were installed street by street.
A transition-aware service visit has a recognizable order. First, identification: the nameplate's refrigerant, model and year, stated aloud so the household and technician share the fact. Second, the leak question, taken seriously — a system low on charge has a leak until proven otherwise, and recharging without finding it is buying the same refrigerant twice on an installment plan. Third, the condition audit around the failure: compressor health, coil condition, electrical wear, because the decision the household faces is about the whole machine, not the one part that stopped. Fourth, the comparison itself, presented as what it is — the repair path with its realistic horizon, the replacement path with its — so the choice is made on the machine's merits and the household's plans for the home. In Lexington that conversation, held in a calm season, is unhurried and genuinely optional-feeling; held in a heat wave, the same facts arrive wearing a deadline.
The regulatory facts are the foundation: R-22 production and import ended in the United States in 2020, leaving reclaimed stock as the supply, while new equipment has moved through R-410A to the current lower-impact generation. In Lexington every generation still stands in service — the transition is not coming to this metro; it is distributed across it, yard by yard.
There is also a quieter loss running underneath the comfort loss: what leaks out was paid to condition. Every run of the system heats or cools a volume of air; the share that escapes into the attic or crawl space is work done for no room, repeated cycle after cycle, season after season. In a Lexington home the arithmetic is worst exactly when the load is highest — the 25.1 hot days push the longest runs through the hottest attics — so the loss curve and the demand curve rise together. Sealing is unglamorous work: mastic on joints, connections re-made and supported, insulation restored where it has fallen. But it is one of the few interventions whose benefit the household can feel at the register on the first run afterward, in air that arrives at the temperature and volume the system produced.
Households judge their heating and cooling at the thermostat, but the thermostat only reports the room it sits in. Judge the system at its furthest register instead: the air arriving there, its temperature against the supply at the unit, its volume against the room's need. In Lexington that furthest room is the honest auditor of the duct network — it inherits every leak, every sag and every degree of attic heat between it and the air handler. The homes whose far rooms match their near rooms have networks that were sealed when they were built and checked as they aged. The homes whose far rooms lag are not necessarily homes with weak equipment; they are homes whose delivery network has been quietly resigning, joint by joint, while the equipment took the blame and the service calls. The register, not the nameplate, is where the resignation is announced.
Consider the delivery assumption: every system in Lexington was sized on the expectation that its air would arrive. With 42.8% of homes built before 1980 — and their networks renovated, extended and re-sealed by turns ever since — that expectation's reliability varies house by house, which is why the measurement, not the assumption, has to govern.
Ageing also changes what a repair means. On a young system, a failed part is an interruption; on an old one, it is information — a data point about the machine's remaining life and about whether the next failure is already loading. In the older districts of Lexington, around Lexington-Fayette urban county and the streets that grew with it, technicians read repairs that way and say so: this motor can be replaced, and here is what its failure tells us about the compressor behind it. The household's decision — maintain, repair, or plan a replacement on a calm schedule — is only as good as that reading. Systems do not owe anyone a warning before their last season, but in practice they file their intentions in a language of rising run times and narrowing margins, for those who have the readings taken.
Judge an ageing system by its trend line, never by its kindest day. On its kindest day — mild weather, light load — almost any system in Lexington can still argue for itself. The trend line is written elsewhere: in run times lengthening season over season, in the setting creeping to hold the same comfort, in the rooms that quietly dropped out of the system's reach. LEXINGTON BLUEGRASS AP, KY US's climate record ensures the trend will be tested at both ends of the year — 25.1 hot days and 89.9 freezing nights in an average year. The households that read their trend early choose the terms of the ending, whether that ending is a renewed component, a planned replacement in a shoulder season, or a few more good years bought with honest maintenance. The households that wait for the system's verdict receive it in the weather least suited to hearing it.
The housing record is the evidence: 17.7% of Lexington's homes predate 1960 and 42.8% predate 1980. Equipment lives and ages inside that stock, so the metro's systems are, as a population, exactly as old as its building history says they should be.
Indoor air quality work begins, in a humid climate, with the admission that moisture is the master variable. Control the moisture and the mold risk falls, the dust mite population thins, the musty chemistry of damp materials quiets, and the cooling system stops fighting a second invisible load. In Lexington that control is a layered project: the envelope and crawl space deciding what enters, the cooling system and any dedicated dehumidification deciding what is removed, ventilation deciding what is exchanged deliberately rather than accidentally. No single gadget carries the project; the layers do. The households that get there describe the result in comfort language — the house feels right at a normal setting — but the mechanics underneath are moisture mechanics, measured in indoor relative humidity readings taken room by room, season by season, against the record at LEXINGTON BLUEGRASS AP, KY US.
Working a humidity complaint follows the water. The first measurements are indoor: relative humidity readings in several rooms, at several times, since a single reading at the thermostat flatters the story. The second look is at the equipment's drying setup — system size against the home's actual load, airflow across the coil, cycle length on a typical afternoon, and the condensate drain's condition and output. The third look is at the sources: crawl space or basement moisture, bathroom and kitchen exhausts that vent into attics instead of outdoors, plumbing weeping quietly somewhere, grade and gutters delivering rainwater to the foundation. Only then does the remedy conversation make sense, because each layer has its own remedy — equipment setup, dedicated dehumidification, ventilation correction, source control — and prescribing from one layer for a problem living in another is how humidity complaints survive multiple service visits.
Housing stacks the burden: Lexington's 98,014 pre-1980 homes bring crawl spaces, older envelopes and duct runs through damp air to the contest. The moisture a system must remove is set by the house it serves — and much of this metro's housing imports generously.
Twice a year, Lexington changes its mind. The shoulder seasons — the weeks when a house can need heating in the morning and cooling by afternoon, sometimes within the same day — ask more of a system and its household than either deep season does: both modes in working order at once, controls set for change rather than for a settled pattern, and equipment that may sit idle for stretches and then be called on without ceremony. The record at LEXINGTON BLUEGRASS AP, KY US frames the workload honestly — 4,432 heating degree days against 1,289 cooling degree days, a genuinely two-season climate — and the shoulders are where the two halves meet and negotiate. The checks that matter are changeover checks: the season just ending reviewed for what it spent — the filter, the wear items, the symptoms it filed — and the season arriving proven before it is needed, with a full run in the new mode while the weather is still forgiving. The thermostat's program belongs in the same check; last season's schedule, carried forward unexamined, is how a house ends up heating against an open-window afternoon. Households that treat the shoulders as their maintenance seasons get two calm, well-timed looks at their system a year — which is exactly the rhythm the equipment's manufacturers had in mind.
The season loads Lexington's systems the way its record at LEXINGTON BLUEGRASS AP, KY US says it will: 4,432 heating degree days against 1,289 cooling degree days in an average year, against a housing stock whose median build year is 1985. The households that read the season early — filters, drains, a system run before the extreme weeks — are the ones whose calls stay schedulable.
The closer look reveals an irony at the transition's core. The systems most exposed to it — the oldest refrigerant generation — are concentrated in the homes least able to treat replacement casually: Lexington's older housing, whose owners inherited their equipment's generation along with its era's ductwork and electrical service. For those households the repair-versus-replace decision carries more weight per dollar, and the quality of the conversation matters accordingly. Good local practice in this metro recognizes the stakes explicitly: present the leak, the machine's full condition, and both paths with their honest horizons, and let the decision be the household's, made with the nameplate fact on the table. The transition will complete itself across this metro one household decision at a time; the households served well are the ones whose decisions were informed rather than hurried.
Strip the pattern down to its inputs and the ranking stops being mysterious: 213,372 households depending on systems installed across a median build year of 1985, in a climate that swings between 25.1 days of serious heat and 89.9 freezing nights. Whatever pattern a metro with those inputs manufactures most, it manufactures here — the lead position is less a title than a consequence, recalculated from the same public records any sceptic can check.
The first visit follows a short, diagnostic list — each item ruling a branch of the problem in or out:
Listed in the order this metro's housing and climate data supports.
Warm air from the vents is a symptom with several authors — capacitor, charge, airflow, controls — and AC repair in Lexington separates them by measurement at your unit, not by parts swapped on hope.
Cooling failure in Lexington is rarely random. It bunches on the first serious heat wave, again in the late-summer grind, and it concentrates where the equipment is oldest — the pre-1980 districts, 42.8% of the metro's housing — and where the newest subdivisions' identical units reach the same wear points in the same seasons. The technician who works these streets stocks the van for both patterns: the ageing system's slow decline and the young fleet's shared failures. Count it in homes if you prefer: 98,014 built before 1980, 62,747 since 2000, one shared system of streets and seasons.
The local caseload behind this service is written in the climate figures: 1,289 cooling degree days a year and 25.1 days at 90 or above, pressing on a cooling fleet whose oldest members serve the 98,014 pre-1980 homes — in Georgetown (38,206 residents) as much as in the oldest districts.
Method separates cleaning from stirring. Negative pressure on the whole network, agitation in every run, registers off and washed, the blower compartment cleared — anything less moves the dust from one room's duct to another's.
What comes out of a Lexington duct system tells the home's biography: drywall dust from the renovation, pet hair in proportion to the household, the fine grit that 49.84 inches of yearly rain and the dry seasons between them work into every return. Cleaning matters most where the biography is long — the pre-1980 homes, 42.8% of the stock — and where a household's breathing argues for it. A technician who shows the before and after, and says plainly when a system does not need the work, is the one whose advice holds up. In Lexington that holds across 28 ZIP codes, from Lexington-Fayette urban county out to Nicholasville.
Duct demand concentrates in the metro's long-biography homes: 98,014 pre-1980 systems that have carried decades of household air, and the renovated homes around Winchester (19,133 residents) whose construction dust is still in the runs.
The failures maintenance interrupts are unglamorous and specific — a condensate drain weeks from flooding, a capacitor drifting out of range, charge seeping from a joint. Each is a small job in spring and a breakdown in July.
Maintenance in Lexington is a calendar with two appointments a year, written by the climate: one before the 25.1 hot days arrive, one before the 89.9 freezing nights do. The cooling visit works the outdoor unit — coils washed, refrigerant pressures read, capacitors and contactors tested, the condensate drain cleared before the humid weeks can clog it. The heating visit works the furnace or heat pump — burners and ignition, the exchanger's condition, venting, airflow. Between them they catch the failures this metro's systems rehearse every year, while those failures are still small. Ask in Winchester and the answer rhymes with Lexington-Fayette urban county: same eras, same equipment generations, same calendar of failures.
The maintenance caseload is the installed base itself: 229,005 housing units whose systems each face 25.1 hot days and 89.9 freezing nights a year. Around Paris (10,107 residents) as in the old core, the twice-yearly visit is what stands between that calendar and the emergency diary.
Moisture cuts both ways. Too little through a heating season cracks wood and dries airways; too much through a cooling season feeds what grows in damp corners. Whole-home control aims at the moving middle, set against the weather outside.
Air quality work in Lexington also has a quiet economics of attention: the households that measure first — a hygrometer on the wall, the filter inspected monthly against the light — tend to need the least equipment, because they catch the simple causes early: the filter long past its season, the bath fan venting into an attic, the return pulling unconditioned air through a leaky duct in the pre-1980 districts. The assessment visit formalises that attention with instruments, and prescribes in proportion to what it finds. It is why two Lexington homes of the same age, on different streets, so often need the same visit in the same year.
The local figures behind the service: 213,372 households, indoor humidity driven by 49.84 inches of yearly rain and long humid stretches, pollen seasons that load every return in Bourbon County. The assessment measures a home against exactly that climate, not against a generic standard.
From period homes near Lexington-Fayette urban county to newer builds toward Winchester, Lexington's ductless projects serve the rooms central systems miss — additions, conversions and homes built without ductwork.
With a median build year of 1985, many Lexington systems are reaching replacement age together; the professional you are connected with inspects ducts and electrics across 28 ZIP codes before recommending equipment.
Furnace repair in Lexington follows the sequence: the independent local professional covering Bourbon, Clark, Fayette, Jessamine, Scott, Woodford watches your furnace attempt a start, tests the stage that failed, and quotes before work begins.
From Lexington-Fayette urban county to Winchester, Lexington installations routed through TempReach USA finish with commissioning — combustion, temperature rise and airflow verified — so the fitted system is the specified system.
Across 28 ZIP codes and housing from a median build year of 1985, Lexington heat pumps are specified and serviced from heat-loss figures and low-temperature performance data, not nominal tonnage.
In Lexington, the thermostat question splits by housing era: homes from around the median build year of 1985 often lack a common wire in the wall, while newer builds across the 28 covered ZIP codes usually carry one — the local professional checks the cable before choosing the control.
Across Bourbon, Clark, Fayette, Jessamine, Scott, Woodford, the local professional who answers knows the stock — a median build year of 1985 across 229,005 homes means systems of every age failing in their characteristic ways, from Lexington-Fayette urban county to the metro's newest subdivisions.
Lexington's commercial buildings span every era around a median build year of 1985 — and with the era goes the equipment, from aging single units over old storefronts to multi-zone systems in new developments, all serviced from a per-unit record.
Ask where this metro's HVAC diary fills up and the answer is a short story: The refrigerant transition reaching older systems first, leaky ducts losing air and energy close behind, and the services that answer them doing the bulk of the booked work. Everything else on the list above is the supporting cast — necessary, frequent enough, but not what Lexington's housing stock, at its age and in its climate, principally demands. Read the service list as a weather report for the metro's systems and it stops looking like a catalogue.
PROBLEM SOLUTION
Population 321,122
Population 38,206
Population 31,625
Population 19,133
Population 10,382
Population 10,107
Population 6,031
Population 1,748
Population 890
Population 703
Population 657
Population 385
Also in the Lexington metro: Keene (population 272), High Bridge (population 65).
The communities in the grid are not suburbs of the page; they are its subject as much as Lexington-Fayette urban county is. Georgetown (38,206 residents) and Nicholasville (31,625) carry their own building decades, their own equipment generations and their own positions in the problem ranking's logic — a system under a Georgetown roof answers to the same data as one in the centre, but to a different era of it. Coverage here is defined by the ZIP list below; understanding is defined street by street, and this page's figures are the metro-wide version of a story each community tells in its own numbers.
Beyond the largest communities sit Winchester (19,133), Versailles (10,382), Paris (10,107), Wilmore (6,031), Midway (1,748) — smaller places across Bourbon, Clark, Fayette, Jessamine, Scott, Woodford, covered on the same terms. Their housing tends to be older on average than the big suburbs', and their calls follow the older patterns on this page. One routing covers them all: find your ZIP code below and the rest is a phone call.
Start with Lexington-Fayette urban county itself: 321,122 residents, 62.1% of the metro — the centre the rest of the map orbits. Georgetown (38,206) and Nicholasville (31,625) form the next ring out, housing with its own building decades and its own equipment generations. Beyond them the metro thins into the smaller communities in the grid above, each a few thousand households deep — small in population, identical in one respect: their systems answer to the same eras and the same weather as the big city's.
One metro, 6 county lines drawn through it: Bourbon, Clark, Fayette, Jessamine, Scott, Woodford. The lines are invisible to the weather, but they structure everything administrative around an HVAC job — which office permits it, which inspector signs it, which code edition applies. Bourbon County, at the centre, carries the oldest housing and the heaviest share of the work this page describes; its neighbours carry the growth. A routed local technician navigates the patchwork so the homeowner does not have to.
Three neighbouring coverage areas begin where this one ends: Louisville, KY, some 67 miles off; Bowling Green, KY, 127 miles; and Cincinnati, OH, 65 miles. Each keeps its own page because each keeps its own numbers — a different median build year, a different climate station, a different problem ranking. Boundary households should trust the ZIP list over the map: the code, not the compass, assigns the dataset.
The region around Lexington is a set of variations on its theme: Louisville, KY, 67 miles off, runs a median build year of 1977 on a metro population of 1,402,509; Bowling Green, KY (127 miles) medians 1991 on 197,180; Cincinnati, OH (65 miles) medians 1975 on 2,312,858. Nearness is not sameness — a few decades of median build year separate their heating and cooling as surely as the miles separate their maps.
The stock has a shape as well as a size. Owners hold 59.6% of it and renters 40.4%, a split that decides who notices a comfort problem first and who arranges the repair. The generations split 1.6-to-one in favour of the pre-1980 homes. And the map divides into 14 named communities across Bourbon, Clark, Fayette, Jessamine, Scott, Woodford, each carrying its era's share of the 229,005 housing units the Census counts here.
Lexington by the derived numbers — median home age 41 years · owners in 127,170 homes, renters in 86,202 · each covered ZIP code carrying about 1,448 pre-1960 homes · a heating-to-cooling degree-day ratio of 3.44 · 1,266 mm average annual rainfall.
County pages carry the local detail — land area, climate normals and the heating and cooling pressures on the ground in each county.
More plain-language help: the TempReach USA heating & cooling guides
TempReach USA routes your call to an independent local heating and cooling professional serving Lexington — the assessment and the work are theirs.
Call center hours: Mon-Fri 7:00 AM-10:00 PM ET | Sat 8:00 AM-10:00 PM ET | Sun 7:00 AM-9:00 PM ET