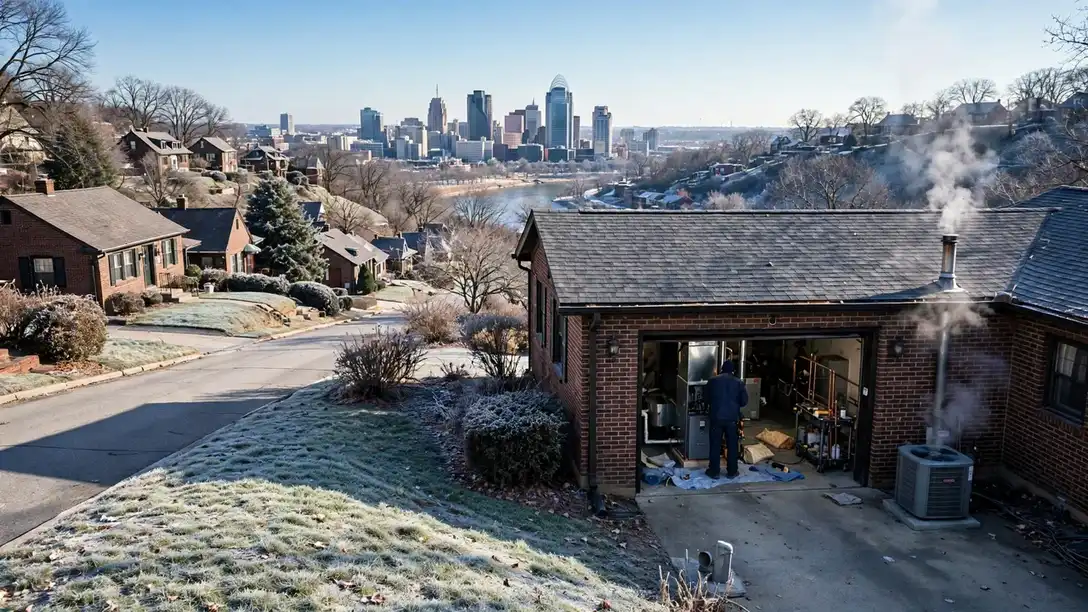


A metro's heating and cooling is a portrait of its building history under its weather, and Cincinnati's portrait is painted below from its own records: Census housing figures, NOAA climate normals, the metro's ZIP codes and communities. TempReach USA's role is the connection to a local professional; the portrait is here so that connection starts from understanding rather than urgency.
Call center hours: Mon-Fri 7:00 AM-10:00 PM ET | Sat 8:00 AM-10:00 PM ET | Sun 7:00 AM-9:00 PM ET
The median Cincinnati home was built in 1975; 56.3% of the stock predates 1980, and the pattern this metro's own data ranks first is the refrigerant transition reaching older systems. TempReach USA is a referral service, not an HVAC company: one call connects you with an independent local HVAC technician serving your ZIP code.
Two numbers frame everything that follows: 68.1% of Cincinnati homes are owner-occupied, and the median one was built in 1975. Ownership matters to HVAC because owners inherit their systems whole — every equipment decision a builder made in the 1970s or earlier is still in the attic, the closet and the side yard, ageing on its original schedule. With 56.3% of homes predating 1980 and 19.5% arriving since 2000, the metro is really two housing stocks sharing one map, and they are taken separately below before the problems are ranked.
There is an equipment timeline buried in Cincinnati's housing figures, and it reads like a technician's diary. The 312,584 homes from before 1960 were heated first and cooled later, their ducts added around floor plans that never imagined them. The 228,908 that followed between 1960 and 1979 mixed those retrofits with the first planned central systems. Then came the 232,755 homes of 1980-1999, fitted with matched systems as standard. Each band of that timeline is now a band of characteristic failures, arriving in the order the equipment tires — which is why a home's build year, in this metro, is the single most predictive fact about its heating and cooling.
The growth side of the metro tells the opposite story in the same language. Hamilton, Middletown and the subdivisions still filling in account for much of the 187,550 homes built since 2000 — matched systems, planned ductwork, heat pumps where the lots suit them. Their HVAC is not old; it is uniform, which creates its own calendar: everything installed in the same boom reaches each wear point in the same years, from the first condenser replacements to the first control-board failures, while 1,160 cooling degree days of annual heat keep demand on the system high.
The weather's part in this is written at CINCINNATI NORTHERN KY AP, KY US, where an average year carries 45.26 inches of precipitation, 22.1 days at ninety degrees or more and 99.8 nights at freezing or below. Systems experience that year as workload and as stakes in roughly equal measure — the workload in the run hours, the stakes on the single coldest night and the single hottest week. The problem ranking further down is simply the housing profile above, read under this sky.
The metro's building eras on one side, its weather record on the other — and its heating and cooling where the two meet.
The distribution, in one breath: of every hundred Cincinnati homes, 32.5 were standing before 1960, 23.8 went up in the two decades after, 24.2 in the two after that, and 19.5 have arrived since 2000. Percentages flatten the picture, so hold the counts beside them — 312,584 oldest-era homes, 187,550 newest — and the metro's heating and cooling stops being an abstraction: it is that many systems, of those ages, failing in that order.
Some metros are defined by their growth; this one is defined by its inheritance. The largest share of Cincinnati's homes was built before 1960, and inheritance in HVAC means system designs from another era serving households who did not choose them. The work that follows from that fact is the metro's staple: furnaces renewed, condensers renewed, ducts sealed and rebalanced — the patient, house-by-house modernisation of a founding stock. Newer districts exist and matter, but they are not where this metro's HVAC character was decided.
The runner-up era is 1980-1999, with 24.2% of homes. That stock has left its carefree decades and entered its maintenance decades, and it shows in the call pattern around Hamilton and the other districts of those years: condensers on their second cycle, furnaces reaching their wear points together, ducts still young enough to reward attention over replacement.
The climate column of this profile is a workload statement. 4,892 heating degree days say how long the cold half of the year keeps furnaces and heat pumps working at their hardest; 1,160 cooling degree days say how relentlessly the hot half loads every condenser and coil; 99.8 freezing nights and 22.1 hot days mark the extremes where the failures concentrate. NOAA keeps these figures at CINCINNATI NORTHERN KY AP, KY US as thirty-year normals — which is to say, as the closest thing HVAC has to a settled forecast.
Hold the two halves together and the rest of this page explains itself: the problems ranked highest here are the ones where Cincinnati's dominant housing era and its climate record overlap. Change either dataset and the ranking changes — which is precisely why this profile is rebuilt from the records for every metro instead of carried over from the last one.
Ordered by what this metro's data says its homes need most.
Age informs an AC repair decision without deciding it — a sound system with a failed motor earns its repair, and an honest diagnosis in Cincinnati will tell you which side of that line your unit stands on.
Ask what fills an AC repair diary in Cincinnati and the answer is written in its housing. The median home was built in 1975, and a good share of the metro's cooling equipment is older than the homes' current owners realise — units sized for a different era of insulation, charged with refrigerant generations that have since been phased down. A system in Dearborn County that cools a little less each summer is telling a story in instalments, and the repair visit reads the whole story: pressures, airflow, the coil's condition, the duct losses behind the walls. It is why two Cincinnati homes of the same age, on different streets, so often need the same visit in the same year.
The local caseload behind this service is written in the climate figures: 1,160 cooling degree days a year and 22.1 days at 90 or above, pressing on a cooling fleet whose oldest members serve the 541,492 pre-1980 homes — in Hamilton (63,124 residents) as much as in the oldest districts.
Where this service gets booked in Cincinnati follows the map on this page: the older districts generate the deep-end work, the post-2000 subdivisions the wear-and-tear work, and the 232,755 homes in between split the difference. Telling the call center your home's build decade — most Cincinnati owners know it within a few years — puts the right kit on the van the first time.
The evidence lives in the returns. Matted dust, debris from construction, hair woven into the load: that is the case for cleaning, made by the ductwork itself. A light film in a tidy system is the case for waiting, and an honest visit says so.
Ducts in Cincinnati collect what the metro's life sends through them: construction dust in the growth subdivisions, decades of household dust in the older districts, pollen riding the return air through long pollen seasons. The honest framing for cleaning is the system's condition, not a calendar — a duct system in a the 1970s home that has been remodelled twice carries a different load from one in a new build near Hamilton. The cleaning visit itself is agitation and extraction under negative pressure, register by register, with the blower compartment and coil inspected while access is open. The 45.26 inches of rain in an average year here is part of the story too — humidity loads every cooling coil in the metro.
Count the systems and the diary fills itself: 899,273 households breathing through ductwork daily, the oldest of it in homes from the 1970s and the newest in the subdivisions past Fairfield. What the cleaning finds follows the biography — dust in proportion to years, debris in proportion to renovations.
One local habit worth copying: Cincinnati homeowners who mention their street's building era when they book get a better-matched visit, because a technician heading to a the 1970s home in Dearborn County loads different parts than one heading to a new-build subdivision in Hamilton. The service is the same; the preparation is local.
The condition report is the product that outlasts the visit. Specific measurements, watch items named, urgency ranked — and next year's visit comparing against this year's numbers, so drift becomes visible before it becomes failure.
Maintenance also has a paperwork virtue in Cincinnati: the recorded visit. Readings dated season by season — refrigerant pressures, temperature splits, capacitor values, the exchanger's noted condition — turn a system's decline from a surprise into a schedule. Households across Dearborn, Franklin, Ohio, Boone, Bracken, Campbell, Gallatin, Grant, Kenton, Pendleton, Brown, Butler, Clermont, Hamilton, Warren who keep those records meet replacements as appointments, and the technicians who write them are leaving the next visit, whoever makes it, a map of the system's life. In a metro of this size, that map is most of what local knowledge means. Count it in homes if you prefer: 541,492 built before 1980, 187,550 since 2000, one shared system of streets and seasons.
The maintenance caseload is the installed base itself: 961,797 housing units whose systems each face 22.1 hot days and 99.8 freezing nights a year. Around Mason (35,148 residents) as in the old core, the twice-yearly visit is what stands between that calendar and the emergency diary.
In Cincinnati this service is booked most often through the problem patterns at the top of this page — the metro's housing data, not habit, sets the order. If your home is in the 56.3% built before 1980, mention its age on the call: it changes the parts the technician loads before heading to Cincinnati and the rest of the metro.
Heat exchanger condition is the line in furnace work: sound, and most faults are repairs; cracked or corroded, and the conversation in any Cincinnati home becomes safety and replacement, plainly explained.
Read Cincinnati's furnace calls as a census and they mirror the housing: the the 1970s districts produce the exchanger and ignition work on equipment in its second or third decade; the growth subdivisions produce the control-board and sensor faults of newer, more electronic systems. Both are furnace repair, but they are different trades inside one name — which is why the technician's first questions here are about the home's age and the unit's, before a single panel comes off. Ask in Fairfield and the answer rhymes with Cincinnati: same eras, same equipment generations, same calendar of failures.
Under Cincinnati's winters lie 4,892 heating degree days a year, and the furnaces answering them include the ageing units of the 541,492 pre-1980 homes alongside the electronic systems of the new subdivisions. The repair diary in Independence reads both ends of that stock in a single week.
In Cincinnati this service is booked most often through the problem patterns at the top of this page — the metro's housing data, not habit, sets the order. If your home is in the 56.3% built before 1980, mention its age on the call: it changes the parts the technician loads before heading to Cincinnati and the rest of the metro.
Safety outranks repair, always. A gas smell or a carbon monoxide alarm means leaving the house and calling the utility or emergency services first — the repair visit comes after the house is safe to be in.
Preparation is the quiet half of emergency work in Cincinnati, and it is written in the metro's figures: a housing stock of 961,797 units, median vintage 1975, spread over 159 ZIP codes, will produce its no-heat and no-cooling nights on a schedule the climate roughly predicts. The households that come through those nights with the least damage are rarely the lucky ones; they are the ones who know where the system's shutoffs and breakers are, keep the number where it can be found, and treat the system's small warnings — the odd noise, the short cycle, the room that drifts — as the appointments they were. From Hamilton to Middletown, the pattern repeats wherever the housing era matches.
The emergency caseload is written in the extremes: 22.1 days of serious heat and 99.8 freezing nights a year, against systems whose median home was built in 1975. In Lebanon as across the metro, the urgent calls arrive when the weather and the equipment's age meet.
In Cincinnati this service is booked most often through the problem patterns at the top of this page — the metro's housing data, not habit, sets the order. If your home is in the 56.3% built before 1980, mention its age on the call: it changes the parts the technician loads before heading to Cincinnati and the rest of the metro.
From Cincinnati to Fairfield, Cincinnati replacements routed through TempReach USA end in commissioning — measured charge and airflow — so the installed system matches the calculated one.
Heating installation in Cincinnati starts with a heat-loss calculation across Dearborn, Franklin, Ohio, Boone, Bracken, Campbell, Gallatin, Grant, Kenton, Pendleton, Brown, Butler, Clermont, Hamilton, Warren: the independent local professional measures the home's loss, inspects ducts and venting, and quotes the full scope before work begins.
From Cincinnati to Fairfield, Cincinnati heat pump calls through TempReach USA reach a local professional who explains findings plainly and quotes after assessing — in the heating season and the cooling season alike.
From period homes near Cincinnati to newer builds toward Fairfield, Cincinnati's ductless projects serve the rooms central systems miss — additions, conversions and homes built without ductwork.
Across Dearborn, Franklin, Ohio, Boone, Bracken, Campbell, Gallatin, Grant, Kenton, Pendleton, Brown, Butler, Clermont, Hamilton, Warren, the housing split decides the starting point: older, leakier homes around Cincinnati usually need filtration and moisture work first, while tighter newer builds in the 159 covered ZIP codes usually need deliberate ventilation most.
Across Dearborn, Franklin, Ohio, Boone, Bracken, Campbell, Gallatin, Grant, Kenton, Pendleton, Brown, Butler, Clermont, Hamilton, Warren, one climate fact shapes the configuration: 4,892 heating degree days against 1,160 cooling degree days tells whether the control's year is mostly a heating story, mostly a cooling story, or a genuine heat pump balancing act.
Cincinnati's commercial buildings span every era around a median build year of 1975 — and with the era goes the equipment, from aging single units over old storefronts to multi-zone systems in new developments, all serviced from a per-unit record.
If this page's services were ranked by Cincinnati's call patterns rather than listed in catalogue order, they would come out much as they do here — because the ranking behind them is data, not habit. The refrigerant transition reaching older systems leads the metro's problem table and leaky ducts losing air and energy follows, so the services answering them lead the list. The long tail of a metro's HVAC life — thermostat calls, duct questions, the one room that never matches the rest — fills in the diary around them, here as everywhere.
Selected and ranked from this metro's housing-age profile and climate record — not copied from another city's page.
A generation change is moving through Cincinnati's cooling equipment, and it arrives one repair decision at a time. For decades, residential systems ran on R-22; production and import of that refrigerant ended in the United States in 2020, so the supply that remains is reclaimed stock, and servicing a leaking R-22 system means weighing a scarce, aging refrigerant against the age of the machine it serves. Newer systems moved to R-410A, and equipment now arriving uses lower-impact refrigerants such as R-454B, with their own handling and code requirements. The transition matters to a homeowner at specific moments: when an older system needs a charge, when a coil or compressor fails on a machine whose refrigerant is effectively retired, when a repair quote must be compared honestly against replacement. Nothing about it is a reason for panic — R-22 systems are not banned from being serviced — but every significant repair on one is now also a planning conversation, and households in Cincinnati with equipment from the R-22 era benefit from having it before the hottest week, not during it.
A transition-aware service visit has a recognizable order. First, identification: the nameplate's refrigerant, model and year, stated aloud so the household and technician share the fact. Second, the leak question, taken seriously — a system low on charge has a leak until proven otherwise, and recharging without finding it is buying the same refrigerant twice on an installment plan. Third, the condition audit around the failure: compressor health, coil condition, electrical wear, because the decision the household faces is about the whole machine, not the one part that stopped. Fourth, the comparison itself, presented as what it is — the repair path with its realistic horizon, the replacement path with its — so the choice is made on the machine's merits and the household's plans for the home. In Cincinnati that conversation, held in a calm season, is unhurried and genuinely optional-feeling; held in a heat wave, the same facts arrive wearing a deadline.
Count the generations the way a technician's route does: a single Cincinnati street can hold an R-22 veteran, two R-410A systems and a current-generation installation within a few doors. The service records of one metro contain the whole transition — which is why identification, not assumption, opens every diagnosis here.
The rooms tell the story before any instrument does. In a Cincinnati home with tired ductwork, the pattern is geographic: the rooms nearest the air handler are comfortable, the far rooms lag, and the rooms over the longest or leakiest runs barely participate. Households adapt without noticing — a fan in the far bedroom, a space heater in the end office — treating as architecture what is actually plumbing for air. Duct runs installed in the metro's big building decades have now spent years in attic heat and crawl-space damp; flex sections sag, inner liners tear, and connections at the plenum work loose a fraction with every season's expansion and contraction. The equipment cycles faithfully and the house still under-delivers, because a system can only condition the air that actually arrives.
Read a duct system the way a technician does and the examination has a shape: start at the air handler and work outward. At the plenum, connections are inspected where they are most stressed and most consequential. Along the runs, the checks are for the known failure family — separated joints, fallen insulation, sagging flex, crushed sections, takeoffs that were sealed with hope rather than mastic. At the registers, temperatures and airflow are compared room by room, and the map of strong and weak rooms is laid over the map of the runs themselves; the two maps explain each other with remarkable consistency. Returns get the same walk, with attention to panned cavities and any path that lets the system breathe from outside the envelope. Cleaning belongs in this picture where the inspection finds accumulation — but cleaning a leaking network without sealing it polishes the inside of a system that is losing its cargo through the walls.
Consider the delivery assumption: every system in Cincinnati was sized on the expectation that its air would arrive. With 56.3% of homes built before 1980 — and their networks renovated, extended and re-sealed by turns ever since — that expectation's reliability varies house by house, which is why the measurement, not the assumption, has to govern.
Every heating and cooling system ages, but in Cincinnati the ageing is concentrated where the housing is. The Census profile behind this page records 56.3% of homes built before 1980 and a median build year of 1975, which means a large share of the metro's furnaces, air conditioners and heat pumps are working in homes that have already outlived one or two generations of equipment — and much of the current generation is itself well into its second decade. Age shows differently than breakdown. An older system loses capacity a little at a time: refrigerant circuits seep at joints that have vibrated for years, blower motors draw more to move the same air, heat exchangers carry scale and rust, and control boards soldier on with components that drift out of tolerance. The household experiences it as a thermostat that needs a lower setting than it used to, rooms that lag, and a system that runs longer to do less. Nothing has failed; everything has faded, and the maintenance question becomes an honest one: what is left in this machine, and what does it need to give it back?
Judge an ageing system by its trend line, never by its kindest day. On its kindest day — mild weather, light load — almost any system in Cincinnati can still argue for itself. The trend line is written elsewhere: in run times lengthening season over season, in the setting creeping to hold the same comfort, in the rooms that quietly dropped out of the system's reach. CINCINNATI NORTHERN KY AP, KY US's climate record ensures the trend will be tested at both ends of the year — 22.1 hot days and 99.8 freezing nights in an average year. The households that read their trend early choose the terms of the ending, whether that ending is a renewed component, a planned replacement in a shoulder season, or a few more good years bought with honest maintenance. The households that wait for the system's verdict receive it in the weather least suited to hearing it.
Climate presses the point. A system in Cincinnati works both ends of the year — 4,892 heating degree days against 1,160 cooling degree days at CINCINNATI NORTHERN KY AP, KY US — so its components accumulate in twelve months the wear a single-season climate would spread over two years.
Ask a furnace what hard cold does to it and it answers in cycles. Every call for heat is a sequence — inducer, igniter, gas valve, flame proving, blower — and deep cold multiplies the sequences while lengthening each run. In Cincinnati the oldest furnaces run that sequence in the oldest housing: the 541,492 pre-1980 homes across the metro, whose flues, ductwork and clearances were built for earlier generations of equipment. A replacement furnace in such a home inherits the harder half of the installation — the venting and duct conditions — while the furnace being retired often shows the season's wear in its heat exchanger and its ignition train. Reading that wear correctly, rather than replacing parts one failure at a time, is the judgment the cold season asks of both homeowner and technician.
The wear itself follows the physics of the machine. A gas furnace lives by controlled fire: it must move air across a heat exchanger that swings from room temperature to several hundred degrees and back, many times a day, all winter. Metal fatigues under that cycling — slowly, invisibly, and faster in a unit that short-cycles because of a dirty filter or an oversized installation. Ignition components live an equally hard life at the small scale: a hot-surface igniter is a ceramic element heated to glowing in seconds, and each heating is a thermal shock. In Cincinnati's 4,892 heating degree days, a furnace may fire tens of thousands of times across its life. The season's failures are rarely mysteries; they are the arithmetic of cycles, arriving on schedule in the coldest weeks because that is when the cycles concentrate.
The timing testifies. Furnace failures in Cincinnati concentrate in the coldest stretches of the 99.8 freezing nights CINCINNATI NORTHERN KY AP, KY US records — the failures follow the load curve, which is the signature of wear meeting demand rather than chance meeting a machine.
A heating failure in mild weather is an appointment. The same failure in a hard freeze is a countdown, because a house without heat in Cincinnati's coldest weather is losing temperature toward the point where its plumbing becomes the next casualty. The record at CINCINNATI NORTHERN KY AP, KY US — 99.8 nights a year at or below freezing and 4,892 heating degree days across the season — says the exposure is not hypothetical here. As indoor temperature falls, the spaces that go first are the ones the heat reached last: pipes in exterior walls, runs through crawl spaces and garages, the plumbing of additions and rooms over unheated ground. A burst pipe discovered at the thaw converts one breakdown into two trades' worth of damage, which is why freeze-season heating calls run on different logic from every other call of the year: restore heat or protect the house, in that order, with no step treated as routine. Knowing the sequence before the night it is needed — how to keep a house safer while help travels, when to drip taps, when to shut water down — is part of owning a heated home in this climate.
The physics of the risk run on a simple clock. A house loses heat through its envelope at a rate set by the temperature difference across it; in a hard freeze that difference is the widest of the year, so the indoor temperature of an unheated house falls fastest exactly when the consequences of falling are gravest. The fall is uneven: rooms over unheated spaces and against the wind cool first, wall cavities housing pipes cool faster than the rooms they serve, and a pipe can reach freezing beside a room that still feels merely chilly. That unevenness is the trap in a household's intuition — the thermostat's reading is the house's average story, while the pipes live in its coldest footnotes. In Cincinnati the margin between a cold night and a damaging one is often a single night's depth of freeze against a house whose heat failed that morning, which is why the response sequence treats hours as the unit of value.
The climate record is the whole brief: 99.8 nights a year at or below freezing and 4,892 heating degree days at CINCINNATI NORTHERN KY AP, KY US. In Cincinnati, a heating failure is never only a heating failure in those weeks — it is a timed exposure for every pipe the heat was guarding, and the record brings the test back annually.
The shoulder season is the system's handover, and like any handover it exposes what the outgoing shift left undone. In Cincinnati, the spring shoulder inherits winter's account — a filter loaded with the heating season, an igniter that has fired its thousands, heating symptoms nobody acted on once the weather softened — while the autumn shoulder inherits summer's: a coil washed by months of condensate, a drain carrying the season's growth, starting parts worn by the hot months' work. Clearing each inheritance before the next season draws on the account is the whole craft here, and it is light work precisely because the weather, for these few weeks, is not in a hurry.
The season loads Cincinnati's systems the way its record at CINCINNATI NORTHERN KY AP, KY US says it will: 4,892 heating degree days against 1,160 cooling degree days in an average year, against a housing stock whose median build year is 1975. The households that read the season early — filters, drains, a system run before the extreme weeks — are the ones whose calls stay schedulable.
In Cincinnati the transition's map is the housing map, lagged by one equipment generation. The districts built around Cincinnati and the the 1970s streets hold the metro's R-22 veterans, in homes that have already seen one full cycle of this story when the equipment before them was young. The middle suburbs hold the R-410A majority. The 187,550 homes built since 2000 carry early current-generation systems now reaching the age where their first major repairs will be quoted — into a market whose standard has already moved on again. Read as a whole, the metro's 961,797 housing units contain the refrigerant industry's last several decades standing in rows, and the service economy of the metro is, in part, the business of keeping all those decades running at once. The deep pattern for a homeowner is simple to state and slow to change: your system's generation is a property of your street's building era, and its implications were installed with the house.
Read the ranking backwards and it reads as a data summary: 2,255,257 residents in 961,797 housing units, 32.5% of the housing from before 1960, 45.26 inches of rain in an average year. The pattern leads because the exposure is broad — counted not in individual unlucky houses but in whole eras of the metro's building, stacked one on another.
Experienced local practice starts with the simple certainties — the observations that take minutes and decide the most:
PROBLEM SOLUTION
Population 309,595
Population 63,124
Population 50,607
Population 44,597
Population 40,902
Population 35,148
Population 32,334
Population 29,024
Population 22,069
Population 21,216
Population 19,994
Population 19,677
Also in the Cincinnati metro: Springboro (population 19,577), Norwood (population 19,023).
Read the grid as a building programme spread over a century. The oldest communities sit where the metro began; the youngest are still adding streets at its edge; and Hamilton and Middletown, with 63,124 and 50,607 residents, stand for the rings in between. Each ring was fitted in its era's equipment, and each is now failing, wearing or holding in its era's characteristic order. The ZIP codes below draw the coverage boundary; the eras inside it draw everything else on this page — the problems ranked, the services ordered, the checks advised.
Beyond the largest communities sit Fairfield (44,597), Covington (40,902), Mason (35,148), Florence (32,334), Independence (29,024) — smaller places across Dearborn, Franklin, Ohio, Boone, Bracken, Campbell, Gallatin, Grant, Kenton, Pendleton, Brown, Butler, Clermont, Hamilton, Warren, covered on the same terms. Their housing tends to be older on average than the big suburbs', and their calls follow the older patterns on this page. One routing covers them all: find your ZIP code below and the rest is a phone call.
Every metro has a first city and a supporting cast, and the census figures draw the billing plainly here: Cincinnati first, with 309,595 residents; Hamilton second at 63,124; Middletown third at 50,607; then the long tail of smaller communities in the grid above. The billing matters less than the building dates — each of these places was fitted with heating and cooling in its own decade, by its own builders — but between them they account for nearly every housing era, equipment generation and failure pattern this page describes.
Administratively the metro is drawn from Dearborn, Franklin, Ohio, Boone, Bracken, Campbell, Gallatin, Grant, Kenton, Pendleton, Brown, Butler, Clermont, Hamilton, Warren — 15 in all — with Dearborn County at its centre. County lines do not change how a system runs, but they do shape the paperwork around the work: permits, inspections and code details are county and city business, which is one reason the professional who serves your street is a local one.
This page ends at the metro boundary, but the region does not: Dayton, OH, Columbus, OH and Toledo, OH continue the coverage in their own directions, each with a profile built from its own Census and NOAA figures. If your home sits near the line between metros, go by your ZIP code — it places you in the dataset that describes your housing.
Set Cincinnati among its neighbours and the contrasts sharpen the profile: Dayton, OH — metro population 826,554, median build year 1968 — sits 60 miles away; Columbus, OH (2,242,028, median 1981) 111 miles; Toledo, OH (599,376, median 1967) 180 miles. Three different housing stocks under three nearby skies, which is why each keeps its own page and its own problem ranking rather than borrowing this one.
Ratios tell the metro's story compactly. Renters occupy 31.9% of homes; owners hold the rest. For every home built since 2000 there are 2.9 from before 1980. Spread the stock across the coverage map and each ZIP code carries about 6,049 housing units — the density at which era patterns repeat street after street instead of scattering, and at which a routed round of calls stays inside a few districts.
The Cincinnati record in one line — median home age: 51 years · owner-occupied homes: 612,405 · renter-occupied homes: 286,868 · pre-1960 homes per covered ZIP code: 1,966 · heating-to-cooling degree-day ratio: 4.22 · average rainfall: 1,150 mm a year.
County pages carry the local detail — land area, climate normals and the heating and cooling pressures on the ground in each county.
More plain-language help: the TempReach USA heating & cooling guides
TempReach USA routes your call to an independent local heating and cooling professional serving Cincinnati — the assessment and the work are theirs.
Call center hours: Mon-Fri 7:00 AM-10:00 PM ET | Sat 8:00 AM-10:00 PM ET | Sun 7:00 AM-9:00 PM ET