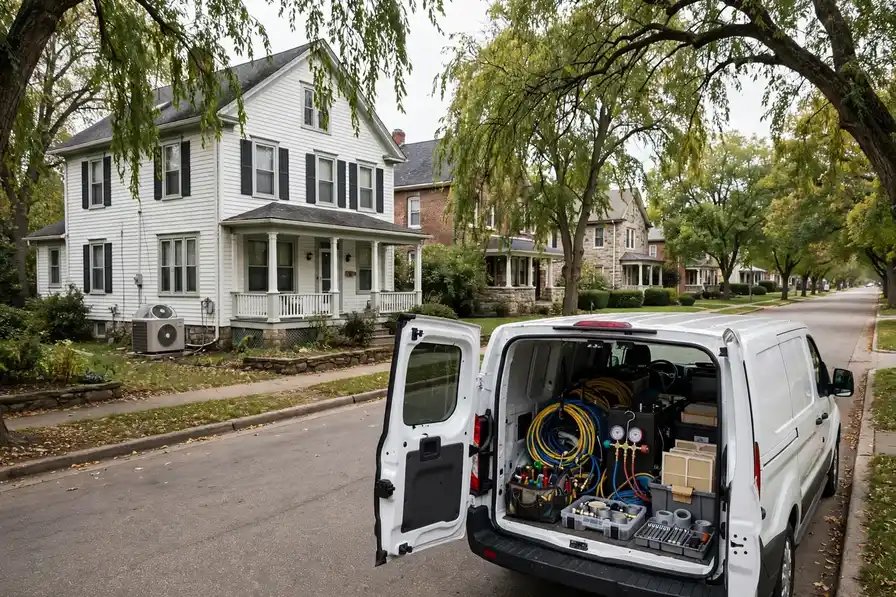


TempReach USA connects Kansas City homeowners with independent local HVAC technicians. This page is built from the metro's own Census housing data, ZIP codes and climate record — the heating and cooling problems described here are the ones Kansas City homes actually have.
Call center hours: Mon-Fri 7:00 AM-10:00 PM ET | Sat 8:00 AM-10:00 PM ET | Sun 7:00 AM-9:00 PM ET
The median Kansas City home was built in 1979; 51.3% of the stock predates 1980, and the pattern this metro's own data ranks first is the refrigerant transition reaching older systems. TempReach USA is a referral service, not an HVAC company: one call connects you with an independent local HVAC technician serving your ZIP code.
Two numbers frame everything that follows: 65.6% of Kansas City homes are owner-occupied, and the median one was built in 1979. Ownership matters to HVAC because owners inherit their systems whole — every equipment decision a builder made in the 1970s or earlier is still in the attic, the closet and the side yard, ageing on its original schedule. With 51.3% of homes predating 1980 and 23.5% arriving since 2000, the metro is really two housing stocks sharing one map, and they are taken separately below before the problems are ranked.
There is an equipment timeline buried in Kansas City's housing figures, and it reads like a technician's diary. The 246,155 homes from before 1960 were heated first and cooled later, their ducts added around floor plans that never imagined them. The 241,403 that followed between 1960 and 1979 mixed those retrofits with the first planned central systems. Then came the 240,452 homes of 1980-1999, fitted with matched systems as standard. Each band of that timeline is now a band of characteristic failures, arriving in the order the equipment tires — which is why a home's build year, in this metro, is the single most predictive fact about its heating and cooling.
The growth side of the metro tells the opposite story in the same language. Overland Park, Olathe and the subdivisions still filling in account for much of the 223,345 homes built since 2000 — matched systems, planned ductwork, heat pumps where the lots suit them. Their HVAC is not old; it is uniform, which creates its own calendar: everything installed in the same boom reaches each wear point in the same years, from the first condenser replacements to the first control-board failures, while 1,446 cooling degree days of annual heat keep demand on the system high.
One more record sits over the whole metro, and it is the one the equipment itself keeps: the weather's. LEES SUMMIT MUNI AP, MO US logs 38.34 inches of precipitation in an average year and swings between 37.7 days at 90 degrees or more and 96.3 nights at or below freezing. Heating systems ride that swing in their run hours; cooling systems ride it in their cycle counts; ducts ride it in the attics, expanding and contracting between the seasons. Cross the swing with the housing ages above and the selection of problems further down this page stops looking like a list and starts looking like an arithmetic result.
Two public records, one metro: what was built here, and what the sky does to it.
Break the stock down by building era and the profile sharpens. Before 1960: 25.9% of homes, roughly 246,155 of them. From 1960 to 1979: 25.4%, about 241,403. From 1980 to 1999: 25.3%, about 240,452. Since 2000: 23.5%, about 223,345. Four eras, four equipment generations — and the balance among them is this metro's HVAC character in a single paragraph.
Vintage is destiny in this metro. With the pre-1960 band the largest of the four, the centre of gravity of Kansas City's heating and cooling sits in houses whose systems have already outlived several generations of equipment — ducts gone leaky inside walls, furnaces renewed and renewed again, cooling retrofitted into floor plans that never imagined it. The later bands matter, and the post-2000 subdivisions will write their own chapter in time, but the calls that define HVAC here come disproportionately from the oldest streets, and they will keep coming until that stock is modernised system by system.
The second band in the table is the 1960-1979 stock: 241,403 homes, 25.4% of the metro. It is the transition generation — cooling arriving, heating generations overlapping, ducts mixed street by street — and it supplies Kansas City with its most diagnostic HVAC: two homes of the same year needing opposite answers, decided by what the builder happened to specify.
Start the climate half where the system starts: at the thermostat's two seasons. Kansas City's cooling answers 1,446 cooling degree days of load and its heating answers 4,786 heating degree days of cold at LEES SUMMIT MUNI AP, MO US — an average temperature of 55.7 degrees that no individual week actually delivers. A heating and cooling system here is never in neutral; the record keeps it working at one end or the other all year.
A profile is only useful if it predicts something, and this one predicts the shape of an HVAC diary in Kansas City: which streets will call about cooling, which about heating, which about airflow, and in which months. Everything after this section is that prediction written out as services, problems and answers — the numbers first, the narrative second, the way the evidence actually runs.
Listed in the order this metro's housing and climate data supports.
Warm air from the vents is a symptom with several authors — capacitor, charge, airflow, controls — and AC repair in Kansas City separates them by measurement at your unit, not by parts swapped on hope.
Ask what fills an AC repair diary in Kansas City and the answer is written in its housing. The median home was built in 1979, and a good share of the metro's cooling equipment is older than the homes' current owners realise — units sized for a different era of insulation, charged with refrigerant generations that have since been phased down. A system in Johnson County that cools a little less each summer is telling a story in instalments, and the repair visit reads the whole story: pressures, airflow, the coil's condition, the duct losses behind the walls. With a median build year of 1979, most of the metro's 950,404 housing units are working through the same ageing curve.
The local caseload behind this service is written in the climate figures: 1,446 cooling degree days a year and 37.7 days at 90 or above, pressing on a cooling fleet whose oldest members serve the 487,557 pre-1980 homes — in Overland Park (197,199 residents) as much as in the oldest districts.
Where this service gets booked in Kansas City follows the map on this page: the older districts generate the deep-end work, the post-2000 subdivisions the wear-and-tear work, and the 240,452 homes in between split the difference. Telling the call center your home's build decade — most Kansas City owners know it within a few years — puts the right kit on the van the first time.
Method separates cleaning from stirring. Negative pressure on the whole network, agitation in every run, registers off and washed, the blower compartment cleared — anything less moves the dust from one room's duct to another's.
What comes out of a Kansas City duct system tells the home's biography: drywall dust from the renovation, pet hair in proportion to the household, the fine grit that 38.34 inches of yearly rain and the dry seasons between them work into every return. Cleaning matters most where the biography is long — the pre-1980 homes, 51.3% of the stock — and where a household's breathing argues for it. A technician who shows the before and after, and says plainly when a system does not need the work, is the one whose advice holds up. Count it in homes if you prefer: 487,557 built before 1980, 223,345 since 2000, one shared system of streets and seasons.
Count the systems and the diary fills itself: 882,252 households breathing through ductwork daily, the oldest of it in homes from the 1970s and the newest in the subdivisions past Independence. What the cleaning finds follows the biography — dust in proportion to years, debris in proportion to renovations.
One local habit worth copying: Kansas City homeowners who mention their street's building era when they book get a better-matched visit, because a technician heading to a the 1970s home in Johnson County loads different parts than one heading to a new-build subdivision in Overland Park. The service is the same; the preparation is local.
The condition report is the product that outlasts the visit. Specific measurements, watch items named, urgency ranked — and next year's visit comparing against this year's numbers, so drift becomes visible before it becomes failure.
The tune-up diary in Kansas City follows the installed base: the pre-1980 districts' ageing systems, kept in service by attention; the middle ring's equipment in its second decade, where maintenance decides whether it sees a third; the subdivisions' matched fleets, all reaching the same service points in the same seasons. A maintenance visit is measurement more than ritual — temperatures, pressures, electrical readings, airflow — recorded against last year's figures, so the system's direction is known rather than guessed. Locally the workload concentrates where the stock is oldest — the districts built around the 1970s first.
Tune-up demand follows the fleet's waves: the subdivisions' matched systems reaching service points together, the pre-1980 districts' individual units on individual schedules. Shawnee sits inside one of those patterns; the readings taken there this season predict its systems' next one.
In Kansas City this service is booked most often through the problem patterns at the top of this page — the metro's housing data, not habit, sets the order. If your home is in the 51.3% built before 1980, mention its age on the call: it changes the parts the technician loads before heading to Kansas City and the rest of the metro.
Every furnace repair routed through TempReach USA ends with a full heating cycle run under observation in the Kansas City home — ignition to steady operation — because a repair is finished when it is proven.
There is a safety grammar to furnace repair in Kansas City that every visit observes: combustion checked, venting verified, the exchanger's integrity read before comfort is discussed. A cracked exchanger or a lazy flame is not a comfort fault wearing a disguise; it is the one finding that changes the visit's whole direction. In a metro where 487,557 homes predate 1980 and their furnaces have been swapped into ageing duct systems more than once, that grammar is the difference between a repair and a recommendation — and honest technicians here will show the homeowner the evidence either way. Ask in Independence and the answer rhymes with Kansas City: same eras, same equipment generations, same calendar of failures.
Under Kansas City's winters lie 4,786 heating degree days a year, and the furnaces answering them include the ageing units of the 487,557 pre-1980 homes alongside the electronic systems of the new subdivisions. The repair diary in Lenexa reads both ends of that stock in a single week.
Where this service gets booked in Kansas City follows the map on this page: the older districts generate the deep-end work, the post-2000 subdivisions the wear-and-tear work, and the 240,452 homes in between split the difference. Telling the call center your home's build decade — most Kansas City owners know it within a few years — puts the right kit on the van the first time.
Most emergency failures are ordinary parts at extraordinary hours, and those are restored on the visit. The major ones are stabilized, diagnosed and quoted from evidence, for a decision made in a safe house.
Preparation is the quiet half of emergency work in Kansas City, and it is written in the metro's figures: a housing stock of 950,404 units, median vintage 1979, spread over 204 ZIP codes, will produce its no-heat and no-cooling nights on a schedule the climate roughly predicts. The households that come through those nights with the least damage are rarely the lucky ones; they are the ones who know where the system's shutoffs and breakers are, keep the number where it can be found, and treat the system's small warnings — the odd noise, the short cycle, the room that drifts — as the appointments they were. The LEES SUMMIT MUNI AP, MO US record — 4,786 heating degree days, 1,446 cooling — is the backdrop Johnson County technicians plan around.
The emergency caseload is written in the extremes: 37.7 days of serious heat and 96.3 freezing nights a year, against systems whose median home was built in 1979. In Leawood as across the metro, the urgent calls arrive when the weather and the equipment's age meet.
In Kansas City this service is booked most often through the problem patterns at the top of this page — the metro's housing data, not habit, sets the order. If your home is in the 51.3% built before 1980, mention its age on the call: it changes the parts the technician loads before heading to Kansas City and the rest of the metro.
With a median build year of 1979, many Kansas City systems are reaching replacement age together; the professional you are connected with inspects ducts and electrics across 204 ZIP codes before recommending equipment.
With 950,404 homes and a median build year of 1979, Kansas City heating stock spans every era of furnace and flue — each installation assessed on its own house, not on the outgoing unit's label.
From Kansas City to Independence, Kansas City heat pump calls through TempReach USA reach a local professional who explains findings plainly and quotes after assessing — in the heating season and the cooling season alike.
Ductless installation in Kansas City is surveyed room by room across Johnson, Leavenworth, Linn, Miami, Wyandotte, Bates, Caldwell, Cass, Clay, Clinton, Jackson, Lafayette, Platte, Ray: the independent local professional calculates each space's load, plans line and drain routes, and quotes the complete design before work begins.
With a median build year of 1979 across 950,404 homes, Kansas City holds both air problems at once — envelopes that leak air freely and envelopes sealed tight — and the local professional assesses which house yours is before recommending equipment.
From Kansas City to the metro's edge, Kansas City's 950,404 homes run every system type there is — single-stage furnaces, two-stage equipment, heat pumps with auxiliary heat — and each gets a control matched to its terminals, not a shelf guess.
Kansas City's commercial buildings span every era around a median build year of 1979 — and with the era goes the equipment, from aging single units over old storefronts to multi-zone systems in new developments, all serviced from a per-unit record.
If this page's services were ranked by Kansas City's call patterns rather than listed in catalogue order, they would come out much as they do here — because the ranking behind them is data, not habit. The refrigerant transition reaching older systems leads the metro's problem table and leaky ducts losing air and energy follows, so the services answering them lead the list. The long tail of a metro's HVAC life — thermostat calls, duct questions, the one room that never matches the rest — fills in the diary around them, here as everywhere.
Selected and ranked from this metro's housing-age profile and climate record — not copied from another city's page.
The transition is, at bottom, a story about what is inside the pipes. A cooling system is not a generic appliance; it is built around a specific refrigerant, with a compressor, metering device and oils chosen for that chemistry, and the generations do not interchange. In Kansas City all the generations are in service simultaneously — R-22 veterans in the older districts, R-410A systems across the middle decades, the newest refrigerant generation arriving in current installations — and a technician's van effectively serves three eras of the same trade at once. The homeowner's part in the story is knowledge of a single fact: which generation is in the backyard. That fact, readable from the nameplate, decides the economics of every leak, every charge and every major component from now on, and it is the first thing a good service conversation establishes.
Judge a refrigerant-era system by its leak history and its trend, not by a single charge reading. One low reading after many tight years is an event; a pattern of small losses is a biography, and the biography is what the economics should be based on. Kansas City's climate record loads the question at both ends — a leaking system underperforms exactly when LEES SUMMIT MUNI AP, MO US's 37.7 hot days demand its full capacity, and its owner pays for refrigerant and lost performance simultaneously. The households that navigate this transition well keep one habit: they can state their system's age, refrigerant and last three repairs without looking them up. That small command of the facts converts an industry-wide generational change into a single household's managed decision, which is the scale at which it was always going to be decided anyway.
Housing arithmetic shows the exposure: with 51.3% of Kansas City's homes built before 1980 and equipment replaced in long cycles ever since, a substantial share of the metro's systems belong to refrigerant generations the market has already succeeded. The nameplates say so, one address at a time.
Returns deserve as much suspicion as supplies. A leaking supply loses conditioned air; a leaking return recruits unconditioned air — hot attic air in summer, cold crawl-space air in winter, and with it the dust and moisture of whichever space it crossed. In Kansas City's older housing, returns are often the rougher half of the network: panned joist spaces, wall cavities pressed into service, connections made to a standard the era allowed. The symptoms point back confusingly — a system that seems to stir dust, rooms that smell of the attic in summer, humidity the air conditioner cannot quite pull down. A duct assessment that only walks the supply side reads half the network. The returns are where the house breathes in, and a home whose returns breathe from its attic will never quite feel the way the equipment's specifications intend.
The construction details explain the timeline. Duct joints are mechanical connections, and the sealants asked to make them permanent have finite lives: cloth-backed tape dries and releases, foil tape lifts at edges, and even mastic can crack where runs move with the building. Flex duct, common in the metro's later building decades, fails at its connections and where its inner liner is pierced or crushed — and a crushed section quietly throttles every room downstream of it. Meanwhile the spaces the ducts cross work against them: attic temperatures in a Kansas City summer turn an uninsulated or leaking run into a heat exchanger pointed the wrong way, and winter reverses the argument in the crawl space. A duct system is therefore not a fixed asset but a slowly changing one, and its delivered performance in any given year is an empirical question, not a memory of its installation day.
Climate sharpens the accounting: in Kansas City the supply runs cross attic air during 37.7 days a year at 90 degrees or more, and crawl-space cold through 96.3 freezing nights. A leak in those spaces is not a small percentage lost politely — it is conditioned air exchanged with the harshest air the house contains.
The oldest systems in Kansas City carry one more complication: their supporting cast is old too. Ductwork sized for an earlier furnace, refrigerant lines run for a refrigerant generation that has since been phased down, thermostats wired before communicating controls existed, electrical panels with no spare capacity for a modern system's starting load. Ageing, in an older home, is a property of the whole installation rather than a single appliance. That is why the honest maintenance conversation in an the 1970s home ranges wider than the nameplate: the machine, its air path, its refrigerant generation and its controls are ageing on four clocks at once, and the visit that checks all four is the one that predicts the year rather than reacting to it.
Judge an ageing system by its trend line, never by its kindest day. On its kindest day — mild weather, light load — almost any system in Kansas City can still argue for itself. The trend line is written elsewhere: in run times lengthening season over season, in the setting creeping to hold the same comfort, in the rooms that quietly dropped out of the system's reach. LEES SUMMIT MUNI AP, MO US's climate record ensures the trend will be tested at both ends of the year — 37.7 hot days and 96.3 freezing nights in an average year. The households that read their trend early choose the terms of the ending, whether that ending is a renewed component, a planned replacement in a shoulder season, or a few more good years bought with honest maintenance. The households that wait for the system's verdict receive it in the weather least suited to hearing it.
The housing record is the evidence: 25.9% of Kansas City's homes predate 1960 and 51.3% predate 1980. Equipment lives and ages inside that stock, so the metro's systems are, as a population, exactly as old as its building history says they should be.
There is a pattern to which furnaces fail in a cold snap: it is the ones that were already negotiating. The unit that locked out twice in December and recovered, the one whose blower grew loud in the season's first month, the one heating an the 1970s home whose ductwork was never generous — the snap does not create their problems, it schedules them simultaneously. In Kansas City a hard cold week therefore reads like a census of deferred maintenance, street by street. The households absent from that census share a habit rather than a budget: their furnaces were looked at before the season turned, by someone who treats an igniter's resistance reading and a flame sensor's condition as the forecasts they are.
A technician reading a tired furnace works from the safety chain outward. Modern furnaces report themselves through lockouts and fault codes, and the pattern of the lockout is the first text: ignition failures point one way, overheating shutdowns another, pressure-switch faults toward venting and condensate. In cold weather the venting branch matters more than households expect — snow, ice and wind can obstruct terminations, and a furnace that will not prove its draft will not fire, by design. The heat exchanger inspection belongs in the same visit whenever age or overheating symptoms suggest it, because a cracked exchanger is the one finding that changes the conversation from repair to replacement on safety grounds. What looks from the hallway like 'the furnace stopped' resolves, under a practiced sequence, into one worn branch of a short list.
The timing testifies. Furnace failures in Kansas City concentrate in the coldest stretches of the 96.3 freezing nights LEES SUMMIT MUNI AP, MO US records — the failures follow the load curve, which is the signature of wear meeting demand rather than chance meeting a machine.
The aftermath has a pattern too. Freeze heating failures in Kansas City are audited at the thaw — twice: once by the technician restoring the system, and once by the water, which reports every pipe the cold found while the heat was off. A burst discovered then is not a separate misfortune; it is the same event's second act, and preventing it is a matter of the first act's management: water shut down and drained where the exposure demanded it, exposed runs protected while the house was cold, the thaw watched rather than assumed. Households that have lived one freeze failure tend to emerge with a written household plan — valve locations, the order of actions, the number to call — because the event teaches what no mild season can: that in this climate, heating is not a comfort system with a plumbing neighbor, but a single system whose failure modes arrive together.
The physics of the risk run on a simple clock. A house loses heat through its envelope at a rate set by the temperature difference across it; in a hard freeze that difference is the widest of the year, so the indoor temperature of an unheated house falls fastest exactly when the consequences of falling are gravest. The fall is uneven: rooms over unheated spaces and against the wind cool first, wall cavities housing pipes cool faster than the rooms they serve, and a pipe can reach freezing beside a room that still feels merely chilly. That unevenness is the trap in a household's intuition — the thermostat's reading is the house's average story, while the pipes live in its coldest footnotes. In Kansas City the margin between a cold night and a damaging one is often a single night's depth of freeze against a house whose heat failed that morning, which is why the response sequence treats hours as the unit of value.
The climate record is the whole brief: 96.3 nights a year at or below freezing and 4,786 heating degree days at LEES SUMMIT MUNI AP, MO US. In Kansas City, a heating failure is never only a heating failure in those weeks — it is a timed exposure for every pipe the heat was guarding, and the record brings the test back annually.
What the shoulders reward is a habit of finishing seasons properly. The last cold week is the time to note the heating system's report card while it is still legible; the last hot week, the cooling system's. Between them sits a window — mild days, an unhurried diary for local technicians, a system that can be opened and tested without the household depending on it that night — that neither deep season gives. In Kansas City that window opens twice a year on a climate of 37.7 hot days and 96.3 freezing nights, and the households that use it convert the two most failure-prone transitions of the year into the two calmest appointments on their calendar.
The season loads Kansas City's systems the way its record at LEES SUMMIT MUNI AP, MO US says it will: 4,786 heating degree days against 1,446 cooling degree days in an average year, against a housing stock whose median build year is 1979. The households that read the season early — filters, drains, a system run before the extreme weeks — are the ones whose calls stay schedulable.
There is a supply-side depth as well. A shrinking refrigerant does not vanish; it circulates — recovered from retired systems, reclaimed to specification, and returned to service at an expense that reflects the shrinking pool. In Kansas City that means the R-22 in a system serviced this year may have cooled three other homes before it, and may cool another after this system retires, provided it is recovered rather than vented. The chain gives older equipment a managed twilight rather than a cliff: service remains possible, performed by technicians qualified for the work, for as long as the economics hold for the household. Understanding that chain replaces two common errors — that old systems are already unserviceable, and that they can be serviced forever as cheaply as ever — with the true picture: a gradually tightening supply, a gradually aging fleet, and a decision that improves with information and worsens with delay.
Read the ranking backwards and it reads as a data summary: 2,202,006 residents in 950,404 housing units, 25.9% of the housing from before 1960, 38.34 inches of rain in an average year. The pattern leads because the exposure is broad — counted not in individual unlucky houses but in whole eras of the metro's building, stacked one on another.
Experienced local practice starts with the simple certainties — the observations that take minutes and decide the most:
PROBLEM SOLUTION
Population 508,233
Population 197,199
Population 143,720
Population 121,944
Population 102,583
Population 68,175
Population 59,416
Population 57,986
Population 37,176
Population 33,844
Population 30,446
Population 29,593
Also in the Kansas City metro: Gladstone (population 27,069), Grandview (population 25,821).
Beyond Kansas City itself, the metro takes in Overland Park (197,199 residents), Olathe (143,720) and the rest of the communities in the grid above — each fitted with heating and cooling in its own building era, which is why two streets in the same metro can need entirely different HVAC conversations. The ZIP list below is the full coverage footprint: if your code is on it, this page was written about your housing stock.
Also on the Kansas City map: Independence (121,944), Lee's Summit (102,583), Shawnee (68,175), Blue Springs (59,416), Lenexa (57,986) — communities spread across Johnson, Leavenworth, Linn, Miami, Wyandotte, Bates, Caldwell, Cass, Clay, Clinton, Jackson, Lafayette, Platte, Ray, each with housing from its own growth years. A technician routed through TempReach USA to any of them is working from this same page: the metro data does not change at the city limit, but the housing on your street — its age, its equipment, its attic — is what the visit is really about.
The metro's weight is not evenly spread. Kansas City holds 508,233 of the 2,202,006 residents; Overland Park and Olathe add 197,199 and 143,720; and the remainder scatters across the smaller places above, some no bigger than a few thousand people. HVAC follows the weight — most calls come from where most homes are — but era matters more than size: a small community of 1960s housing generates older-system work than a large new subdivision does.
One metro, 14 county lines drawn through it: Johnson, Leavenworth, Linn, Miami, Wyandotte, Bates, Caldwell, Cass, Clay, Clinton, Jackson, Lafayette, Platte, Ray. The lines are invisible to the weather, but they structure everything administrative around an HVAC job — which office permits it, which inspector signs it, which code edition applies. Johnson County, at the centre, carries the oldest housing and the heaviest share of the work this page describes; its neighbours carry the growth. A routed local technician navigates the patchwork so the homeowner does not have to.
Beyond the metro line, the nearest covered metros are Columbia, MO (101 miles away), Jefferson City, MO (128 miles) and Joplin, MO (133 miles) — separate pages, separate profiles, because their housing and weather records are their own. Homeowners near the boundary sit between two datasets; the ZIP list above, not the map's edge, decides which page was written about your stock.
Set Kansas City among its neighbours and the contrasts sharpen the profile: Columbia, MO — metro population 219,062, median build year 1990 — sits 101 miles away; Jefferson City, MO (152,712, median 1982) 128 miles; Joplin, MO (208,796, median 1982) 133 miles. Three different housing stocks under three nearby skies, which is why each keeps its own page and its own problem ranking rather than borrowing this one.
Divide the stock by the map and the densities appear: roughly 4,659 housing units for every covered ZIP code, 63,018 households to a county, 14 named communities in the grid. The balance between the generations reads 2.2 pre-1980 homes for every home built since 2000 — a single ratio that quietly predicts whether a metro's HVAC week leans toward renewal work in the old districts or first-generation upkeep in the new ones.
The Kansas City record in one line — median home age: 47 years · owner-occupied homes: 578,757 · renter-occupied homes: 303,495 · pre-1960 homes per covered ZIP code: 1,207 · heating-to-cooling degree-day ratio: 3.31 · average rainfall: 974 mm a year.
County pages carry the local detail — land area, climate normals and the heating and cooling pressures on the ground in each county.
More plain-language help: the TempReach USA heating & cooling guides
TempReach USA routes your call to an independent local heating and cooling professional serving Kansas City — the assessment and the work are theirs.
Call center hours: Mon-Fri 7:00 AM-10:00 PM ET | Sat 8:00 AM-10:00 PM ET | Sun 7:00 AM-9:00 PM ET