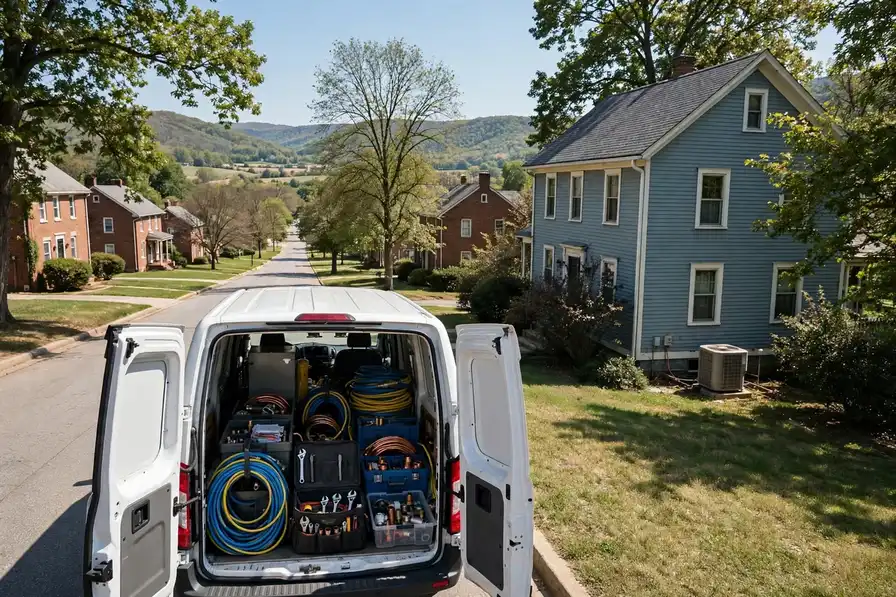


Everything on this page was computed for Columbia and nowhere else: the problem ranking from its Census housing profile, the seasonal risks from its NOAA station record, the coverage from its own ZIP codes. TempReach USA connects you to an independent local HVAC technician; the page itself is the homework, done in public, so the call you make is an informed one.
Call center hours: Mon-Fri 7:00 AM-10:00 PM ET | Sat 8:00 AM-10:00 PM ET | Sun 7:00 AM-9:00 PM ET
The median Columbia home was built in 1990; 37.1% of the stock predates 1980, and the pattern this metro's own data ranks first is the refrigerant transition reaching older systems. TempReach USA is a referral service, not an HVAC company: one call connects you with an independent local HVAC technician serving your ZIP code.
Start with the raw material: 212,850 people, 92,569 housing units, and a housing stock whose middle home was built in 1990. That single date organises everything on this page. On one side of it stand the older districts — 14.3% of homes predate 1960, 37.1% predate 1980 — heated and cooled by systems renewed in pieces for decades, in homes across Boone, Cooper, Howard. On the other side, the 32.9% built since 2000 run matched modern equipment, and fail in the newer ways. A Columbia technician reads a home's build year the way a doctor reads a chart: it predicts, before a single panel is opened, which systems deserve suspicion first.
The pre-1980 stock is where most of the metro's HVAC character lives. Homes from those decades in Boone County and across Boone, Cooper, Howard were built with duct layouts from the first age of central systems, furnaces and condensers that have since been renewed piecemeal, and insulation standards from another era, and each of those choices is now at or beyond the age its makers expected of it. Owner-occupiers hold 60.5% of the metro's homes, so most of the people reading this page are reading about a system they own outright — one whose failures arrive as surprises only if nobody has looked at the pattern: cooling fading a little each summer, a furnace recovering a little more slowly, one room drifting a little further from the thermostat.
The growth side of the metro tells the opposite story in the same language. Boonville, Ashland and the subdivisions still filling in account for much of the 30,455 homes built since 2000 — matched systems, planned ductwork, heat pumps where the lots suit them. Their HVAC is not old; it is uniform, which creates its own calendar: everything installed in the same boom reaches each wear point in the same years, from the first condenser replacements to the first control-board failures, while 1,448 cooling degree days of annual heat keep demand on the system high.
One more record sits over the whole metro, and it is the one the equipment itself keeps: the weather's. COLUMBIA RGNL AP, MO US logs 41.43 inches of precipitation in an average year and swings between 34.7 days at 90 degrees or more and 101.1 nights at or below freezing. Heating systems ride that swing in their run hours; cooling systems ride it in their cycle counts; ducts ride it in the attics, expanding and contracting between the seasons. Cross the swing with the housing ages above and the selection of problems further down this page stops looking like a list and starts looking like an arithmetic result.
Two public records, one metro: what was built here, and what the sky does to it.
The distribution, in one breath: of every hundred Columbia homes, 14.3 were standing before 1960, 22.8 went up in the two decades after, 30.0 in the two after that, and 32.9 have arrived since 2000. Percentages flatten the picture, so hold the counts beside them — 13,237 oldest-era homes, 30,455 newest — and the metro's heating and cooling stops being an abstraction: it is that many systems, of those ages, failing in that order.
Growth is the headline in Columbia: the post-2000 band is the largest, much of it subdivisions fitted with matched modern systems and ductwork designed as a single plan. The work here is young-stock work — first replacements arriving in waves as whole streets age together, heat pumps standard where their neighbours have furnaces, controls and sensors failing in preference to iron. The metro's older pockets still generate the deep problems, but the volume of its HVAC future is being written in the new subdivisions.
Second in the table, the 1980-1999 band: 27,771 homes, 30.0% of the metro. Its systems are mature rather than ancient — ducts still sound, first-generation efficiency equipment wearing toward its verdicts, controls reaching their wear points in waves — and its HVAC is the schedulable kind: work that rewards being booked before it becomes urgent.
Columbia's weather, reduced to what a system experiences: 34.7 hot days a year loading the cooling, 101.1 freezing nights loading the heating, and 41.43 inches of rain feeding the humidity both seasons complain about. NOAA's normals at COLUMBIA RGNL AP, MO US — 4,681 heating degree days, 1,448 cooling degree days — are the long average of that experience, and they are why this metro's problem list is not interchangeable with a milder or harsher metro's.
Hold the two halves together and the rest of this page explains itself: the problems ranked highest here are the ones where Columbia's dominant housing era and its climate record overlap. Change either dataset and the ranking changes — which is precisely why this profile is rebuilt from the records for every metro instead of carried over from the last one.
Chosen by this metro's own housing and weather data — the same two records this whole page is built from.
It is worth saying plainly what the transition is not. It is not a mandate to replace working equipment, not a deadline after which older systems become unusable, and not a verdict on the many R-22 and early R-410A systems still cooling Columbia homes adequately. Systems are retired by economics and condition, not by calendar. What the transition changes is the slope of those economics: each year, the older generation's refrigerant and parts grow scarcer while the machine itself grows older, so the repair-versus-replace crossing arrives a little earlier than the same failure would have suggested a decade ago. Honest service practice in this metro states that slope openly and lets the household's own numbers — the unit's age, its condition, its history — make the call. The refrigerant in the pipes has become a fact of the house, like its roof's age: not urgent every day, and unwise to leave unexamined.
The mechanics underneath the policy are simple. A refrigerant is the working fluid of the cooling cycle: it evaporates indoors to absorb heat and condenses outdoors to release it, thousands of times a season. Each generation of fluid was engineered to improve on the last one's environmental profile and operating pressures, and each required its own hardware — compressors built for different pressures, oils that mix with one fluid and not another, metering set for one fluid's characteristics. That is why the generations cannot be swapped like brands of the same product, and why 'topping up' an older system always means its own fluid, sourced from whatever supply its generation still commands. In Columbia, where systems from all three generations stand in neighboring yards, the diversity is a service reality: diagnosis begins with identification, because the same symptom — a system low on charge — carries three different expense structures depending on the nameplate.
Count the generations the way a technician's route does: a single Columbia street can hold an R-22 veteran, two R-410A systems and a current-generation installation within a few doors. The service records of one metro contain the whole transition — which is why identification, not assumption, opens every diagnosis here.
A duct system is a delivery network, and in many Columbia homes it leaks like one. Supply runs carry conditioned air through attics, crawl spaces and wall cavities on their way to the registers; return runs carry it back. Every joint, seam and connection along those paths is a chance for the air to leave early or for unconditioned air to be pulled in, and older installations — assembled with tape that has long since dried out, or sections that have sagged apart — leak at many of them at once. The system responds the only way it can: by running longer to deliver the same comfort, which is why duct loss so often disguises itself as an equipment problem. The furnace and air conditioner get blamed, serviced, sometimes replaced, while the network between them quietly spills a share of every run into the attic. In Columbia's housing, where duct runs cross some of the hottest and coldest spaces in the home, a leak counts double: the air is lost, and the air that remains arrives changed by the space it traveled through.
The construction details explain the timeline. Duct joints are mechanical connections, and the sealants asked to make them permanent have finite lives: cloth-backed tape dries and releases, foil tape lifts at edges, and even mastic can crack where runs move with the building. Flex duct, common in the metro's later building decades, fails at its connections and where its inner liner is pierced or crushed — and a crushed section quietly throttles every room downstream of it. Meanwhile the spaces the ducts cross work against them: attic temperatures in a Columbia summer turn an uninsulated or leaking run into a heat exchanger pointed the wrong way, and winter reverses the argument in the crawl space. A duct system is therefore not a fixed asset but a slowly changing one, and its delivered performance in any given year is an empirical question, not a memory of its installation day.
The housing numbers frame the exposure: 92,569 housing units in Columbia, a median build year of 1990, and duct networks installed era by era in attics, crawl spaces and wall cavities. Every one of those networks is a set of joints ageing in the dark — the loss pool is the size of the metro itself.
The physics of the complaint are stacked against the single-thermostat house. Warm air rises, so a second storey collects the first floor's heat all day and adds its own roof load on top; in a Columbia summer, the upstairs of a two-storey home is simply a hotter building than its ground floor, served by the same machine. Duct design compounds it: runs to the far and upper rooms are the longest, the most jointed and the first to lose pressure, so the rooms with the greatest need often receive the least delivery. Households compensate in the classic ways — closing registers downstairs to push air up, which raises system pressure and can harm the equipment, or overcooling the whole house to satisfy its warmest room, paying to refrigerate satisfied rooms as the toll for one comfortable room. The complaint persists because its cause is structural; it yields to structural answers.
Judge a multi-room home at its extremes, not at its thermostat. The thermostat sits, by convention, in the home's most average room, and it will report contentment while the nursery roasts and the end office freezes. The extremes are the system's true report card, and in Columbia they follow the climate record honestly: 34.7 hot days audit the upstairs, 101.1 freezing nights audit the far rooms over unheated spaces, and the household learns its home's real climate map from the rooms it avoids in each season. Homes whose extremes are comfortable have been sorted — by design, by correction or by dedicated equipment — and homes whose extremes are endured are carrying an unsorted map. The sorting is a solvable problem in essentially every case; what it cannot survive is being mistaken for an equipment failure and treated with a bigger version of the same single answer.
Housing counts the exposure: Columbia's 92,569 housing units include the multi-storey plans and large footprints of its growth decades — the geometry that manufactures this complaint — alongside the renovated older homes around Columbia whose additions rewrote their load maps.
What the shoulders reward is a habit of finishing seasons properly. The last cold week is the time to note the heating system's report card while it is still legible; the last hot week, the cooling system's. Between them sits a window — mild days, an unhurried diary for local technicians, a system that can be opened and tested without the household depending on it that night — that neither deep season gives. In Columbia that window opens twice a year on a climate of 34.7 hot days and 101.1 freezing nights, and the households that use it convert the two most failure-prone transitions of the year into the two calmest appointments on their calendar.
The season loads Columbia's systems the way its record at COLUMBIA RGNL AP, MO US says it will: 4,681 heating degree days against 1,448 cooling degree days in an average year, against a housing stock whose median build year is 1990. The households that read the season early — filters, drains, a system run before the extreme weeks — are the ones whose calls stay schedulable.
The closer look reveals an irony at the transition's core. The systems most exposed to it — the oldest refrigerant generation — are concentrated in the homes least able to treat replacement casually: Columbia's older housing, whose owners inherited their equipment's generation along with its era's ductwork and electrical service. For those households the repair-versus-replace decision carries more weight per dollar, and the quality of the conversation matters accordingly. Good local practice in this metro recognizes the stakes explicitly: present the leak, the machine's full condition, and both paths with their honest horizons, and let the decision be the household's, made with the nameplate fact on the table. The transition will complete itself across this metro one household decision at a time; the households served well are the ones whose decisions were informed rather than hurried.
Strip the pattern down to its inputs and the ranking stops being mysterious: 84,722 households depending on systems installed across a median build year of 1990, in a climate that swings between 34.7 days of serious heat and 101.1 freezing nights. Whatever pattern a metro with those inputs manufactures most, it manufactures here — the lead position is less a title than a consequence, recalculated from the same public records any sceptic can check.
On a first visit for this pattern, a local technician's checks run in a practised order:
Sequenced by this metro's own problem ranking, not by a national catalogue order.
Every repair through TempReach USA follows the same order: diagnosis at the equipment, findings explained, quote given before work begins, and a full test cycle before the technician leaves your Columbia home.
Cooling failure in Columbia is rarely random. It bunches on the first serious heat wave, again in the late-summer grind, and it concentrates where the equipment is oldest — the pre-1980 districts, 37.1% of the metro's housing — and where the newest subdivisions' identical units reach the same wear points in the same seasons. The technician who works these streets stocks the van for both patterns: the ageing system's slow decline and the young fleet's shared failures. Locally the workload concentrates where the stock is oldest — the districts built around the 1990s first.
The local caseload behind this service is written in the climate figures: 1,448 cooling degree days a year and 34.7 days at 90 or above, pressing on a cooling fleet whose oldest members serve the 34,343 pre-1980 homes — in Boonville (7,682 residents) as much as in the oldest districts.
Post-renovation is the clearest case in the trade. Drywall dust and sanding residue settle through every open register, and one thorough cleaning after the work ends removes in hours what the system would otherwise circulate for years.
A word on timing, since Columbia households ask: duct cleaning earns its appointment when the evidence calls for it — after construction or renovation dust, when a home changes hands after years of one household's accumulation, when the registers show visible load or the blower compartment tells the story. Booked on evidence, it is honest work with visible results. Booked on a calendar superstition, it is a van ride. Local technicians who work from the evidence are the ones this page's routing favours, in Columbia and across the metro alike. That is the daily reality for the 84,722 households spread across Boone, Cooper, Howard.
Duct demand concentrates in the metro's long-biography homes: 34,343 pre-1980 systems that have carried decades of household air, and the renovated homes around Fayette (2,800 residents) whose construction dust is still in the runs.
A mini-split heats as completely as it cools; in Columbia the cold-climate models' published low-temperature figures decide whether a room can retire its old heaters or keeps them as support.
Ductless systems find their Columbia homes where ductwork never went: the older districts' additions and converted spaces, the pre-1960 homes — 14.3% of the metro — built around boilers or gravity heat, the workshops and finished basements of the growth suburbs. A mini-split heats and cools a defined space without asking the house to grow ducts, which is why the assessment starts with the space itself: its exposure, its insulation era, how it is actually used across 34.7 hot days and the winter's coldest weeks. In Columbia that holds across 22 ZIP codes, from Columbia out to Ashland.
The search territory for ductless is the metro's unducted stock: 13,237 pre-1960 homes built before central systems, plus the additions and conversions scattered through 84,722 households — in Sturgeon and the historic core alike, spaces the main system never reached.
Furnace repair in Columbia follows the sequence: the independent local professional covering Boone, Cooper, Howard watches your furnace attempt a start, tests the stage that failed, and quotes before work begins.
Across Boone, Cooper, Howard, the local professional who answers knows the stock — a median build year of 1990 across 92,569 homes means systems of every age failing in their characteristic ways, from Columbia to the metro's newest subdivisions.
Replacement in Columbia begins with a load calculation across Boone, Cooper, Howard: the independent local professional measures the home — not the old unit's label — and quotes the full scope before work begins.
From Columbia to Fayette, Columbia installations routed through TempReach USA finish with commissioning — combustion, temperature rise and airflow verified — so the fitted system is the specified system.
From Columbia to Fayette, Columbia heat pump calls through TempReach USA reach a local professional who explains findings plainly and quotes after assessing — in the heating season and the cooling season alike.
In Columbia, air work follows the climate ledger: 4,681 heating degree days dry the indoor air out each winter while 1,448 cooling degree days load it with humidity each summer — most homes here need the humidity answer in both directions across the year.
In Columbia, the thermostat question splits by housing era: homes from around the median build year of 1990 often lack a common wire in the wall, while newer builds across the 22 covered ZIP codes usually carry one — the local professional checks the cable before choosing the control.
Across Boone, Cooper, Howard, the service record is the scarcest asset: with a median build year of 1990 across 92,569 homes, many systems around Columbia have no documented history — and a first tune-up's baseline is what every later decision stands on.
Across Boone, Cooper, Howard, one climate ledger drives the calendar: 4,681 heating degree days and 1,448 cooling degree days mean roof units work both seasons hard, so the spring and fall visits each carry a full checklist here.
Ask where this metro's HVAC diary fills up and the answer is a short story: The refrigerant transition reaching older systems first, leaky ducts losing air and energy close behind, and the services that answer them doing the bulk of the booked work. Everything else on the list above is the supporting cast — necessary, frequent enough, but not what Columbia's housing stock, at its age and in its climate, principally demands. Read the service list as a weather report for the metro's systems and it stops looking like a catalogue.
PROBLEM SOLUTION
Population 127,200
Population 7,682
Population 4,811
Population 2,800
Population 2,049
Population 1,143
Population 1,054
Population 1,015
Population 646
Population 454
Population 420
Population 344
Also in the Columbia metro: Armstrong (population 340), Bunceton (population 269).
Beyond Columbia itself, the metro takes in Boonville (7,682 residents), Ashland (4,811) and the rest of the communities in the grid above — each fitted with heating and cooling in its own building era, which is why two streets in the same metro can need entirely different HVAC conversations. The ZIP list below is the full coverage footprint: if your code is on it, this page was written about your housing stock.
The map continues: Fayette (2,800), Hallsville (2,049), Sturgeon (1,143), Glasgow (1,054), New Franklin (1,015). Different names, different decades — each community in Boone, Cooper, Howard was fitted with heating and cooling in its own growth years, which is why two streets in the same metro can need entirely different HVAC conversations. The ZIP list below is the working definition of coverage; the housing behind each code is the working definition of the job.
Start with Columbia itself: 127,200 residents, 59.8% of the metro — the centre the rest of the map orbits. Boonville (7,682) and Ashland (4,811) form the next ring out, housing with its own building decades and its own equipment generations. Beyond them the metro thins into the smaller communities in the grid above, each a few thousand households deep — small in population, identical in one respect: their systems answer to the same eras and the same weather as the big city's.
Draw the metro by its paperwork and it resolves into Boone, Cooper, Howard — 3 jurisdictions sharing one housing stock and one weather system. Boone County holds the historic centre and the densest share of the older homes; the surrounding counties hold the rings of growth around it. Permits and inspections follow those boundaries even though temperature never does, which is part of why the technician this page connects you to works these streets specifically.
Three neighbouring coverage areas begin where this one ends: Jefferson City, MO, some 36 miles off; Kansas City, MO, 101 miles; and Springfield, MO, 117 miles. Each keeps its own page because each keeps its own numbers — a different median build year, a different climate station, a different problem ranking. Boundary households should trust the ZIP list over the map: the code, not the compass, assigns the dataset.
The region around Columbia is a set of variations on its theme: Jefferson City, MO, 36 miles off, runs a median build year of 1982 on a metro population of 152,712; Kansas City, MO (101 miles) medians 1979 on 2,270,682; Springfield, MO (117 miles) medians 1987 on 500,694. Nearness is not sameness — a few decades of median build year separate their heating and cooling as surely as the miles separate their maps.
The stock has a shape as well as a size. Owners hold 60.5% of it and renters 39.5%, a split that decides who notices a comfort problem first and who arranges the repair. The generations split 1.1-to-one in favour of the pre-1980 homes. And the map divides into 14 named communities across Boone, Cooper, Howard, each carrying its era's share of the 92,569 housing units the Census counts here.
One line of Columbia arithmetic — a median home 36 years old · 51,257 owner-occupied homes against 33,465 renter-occupied · 602 pre-1960 homes for every covered ZIP code · a heating-to-cooling degree-day ratio of 3.23 · 1,052 mm of rain in an average year.
County pages carry the local detail — land area, climate normals and the heating and cooling pressures on the ground in each county.
More plain-language help: the TempReach USA heating & cooling guides
One call connects you with an independent local heating and cooling professional serving Columbia and the surrounding metro.
Call center hours: Mon-Fri 7:00 AM-10:00 PM ET | Sat 8:00 AM-10:00 PM ET | Sun 7:00 AM-9:00 PM ET