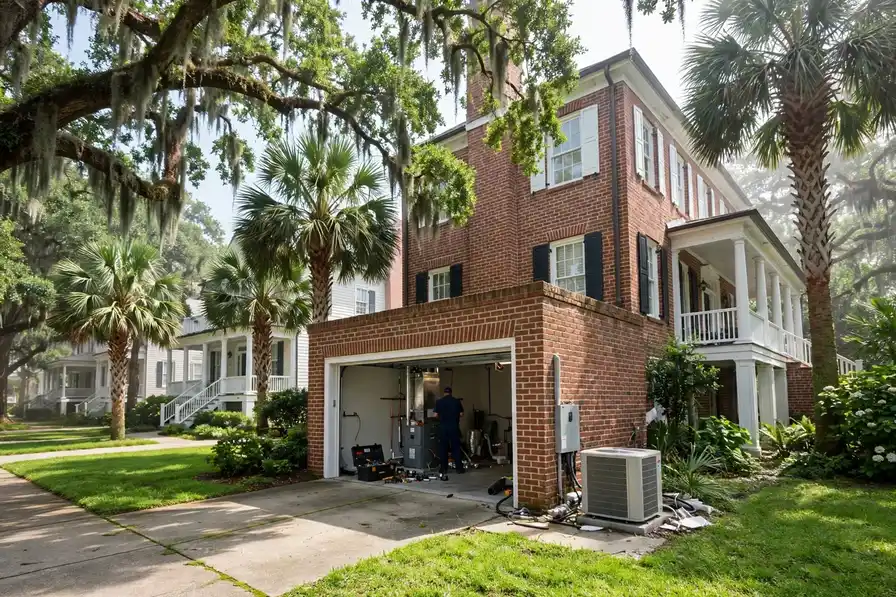


A metro's heating and cooling is a portrait of its building history under its weather, and Charleston's portrait is painted below from its own records: Census housing figures, NOAA climate normals, the metro's ZIP codes and communities. TempReach USA's role is the connection to a local professional; the portrait is here so that connection starts from understanding rather than urgency.
Call center hours: Mon-Fri 7:00 AM-10:00 PM ET | Sat 8:00 AM-10:00 PM ET | Sun 7:00 AM-9:00 PM ET
The median Charleston home was built in 1995; 28.6% of the stock predates 1980, and the pattern this metro's own data ranks first is humidity burden on homes and cooling systems. TempReach USA is a referral service, not an HVAC company: one call connects you with an independent local HVAC technician serving your ZIP code.
Charleston is a metro of 817,756 people and 327,420 households, and its heating and cooling is a portrait of its building history. The median home here was built in 1995; 28.6% of homes predate 1980 and 10.1% predate 1960, while 42.6% have arrived since 2000. Every one of those eras heated and cooled differently — different furnaces, different duct designs, different refrigerant generations — and they fail differently, which is why this page is organised around the patterns the data actually produces in Charleston rather than HVAC in the abstract.
Stand in one of Charleston's older neighbourhoods and you are standing in its HVAC's back catalogue. The homes there — part of the 105,890 built before 1980 across this metro — went up when a furnace was built to serve for a generation and central cooling was still spreading street by street. That generation has now elapsed several times over. What it leaves behind is not universal failure but universal exposure: every duct joint, igniter and condenser coil in those districts is operating past the horizon its makers planned for, in Berkeley County and beyond, and the failures arrive in the order the parts tire.
Uniformity is the newer stock's defining trait. A subdivision in North Charleston or Mount Pleasant went up in a handful of years, fitted with one generation of equipment, one duct design, one thermostat class. That uniformity writes a calendar the whole street shares: the first heating wave, the first cooling wave, the first questions about refrigerant and charge arrive together, years before the same streets need anything structural. With 42.6% of the metro built since 2000, that calendar governs a large and growing share of Charleston's HVAC work — predictable work, if a household reads the calendar early.
One more record sits over the whole metro, and it is the one the equipment itself keeps: the weather's. CHARLESTON INTL AP, SC US logs 52.51 inches of precipitation in an average year and swings between 64.3 days at 90 degrees or more and 22.4 nights at or below freezing. Heating systems ride that swing in their run hours; cooling systems ride it in their cycle counts; ducts ride it in the attics, expanding and contracting between the seasons. Cross the swing with the housing ages above and the selection of problems further down this page stops looking like a list and starts looking like an arithmetic result.
Housing eras and climate, joined — the two datasets every section of this page is built from.
Break the stock down by building era and the profile sharpens. Before 1960: 10.1% of homes, roughly 37,395 of them. From 1960 to 1979: 18.5%, about 68,496. From 1980 to 1999: 28.7%, about 106,261. Since 2000: 42.6%, about 157,725. Four eras, four equipment generations — and the balance among them is this metro's HVAC character in a single paragraph.
New-stock metros have their own signature, and Charleston has it in full: most homes built since 2000, most systems young, most HVAC work a matter of waves — the condenser wave, the control-board wave, the first furnace questions — arriving street by street as identical subdivisions age in lockstep. The older pockets still produce the deepest single jobs, but the metro's HVAC centre of mass sits in its newest postcodes, and every year the waves get closer together.
The runner-up era is 1980-1999, with 28.7% of homes. That stock has left its carefree decades and entered its maintenance decades, and it shows in the call pattern around North Charleston and the other districts of those years: condensers on their second cycle, furnaces reaching their wear points together, ducts still young enough to reward attention over replacement.
The climate half of the profile, from CHARLESTON INTL AP, SC US: 1,844 heating degree days against 2,434 cooling degree days, 52.51 inches of precipitation, an average temperature of 66.5 degrees. Read together, those figures describe the loads: how many hours a furnace runs in a year, how relentlessly a condenser cycles through summer, how much moisture the cooling coil must pull from the air — 22.4 nights at or below freezing, against 64.3 days at 90 or above.
A profile is only useful if it predicts something, and this one predicts the shape of an HVAC diary in Charleston: which streets will call about cooling, which about heating, which about airflow, and in which months. Everything after this section is that prediction written out as services, problems and answers — the numbers first, the narrative second, the way the evidence actually runs.
Ranked for this metro alone, from its Census housing profile and NOAA climate record.
The oversized system is humidity's favorite accomplice. In Charleston, cooling equipment has often been replaced like for like or rounded up in size over the years, and a unit with more capacity than the house needs satisfies the thermostat quickly — then stops, with the coil warming and its collected moisture still in the air stream's neighborhood. Temperature is a fast variable; moisture is a slow one. A house can hit its setting while barely denting its indoor humidity, and the gap between the two is where the clammy afternoons live. Correct sizing, correct airflow and longer, steadier cycles are the equipment side of the answer; the house side — ventilation of wet rooms, vapor sources managed, drainage and grade outside — decides how much burden arrives for the equipment to carry in the first place.
Working a humidity complaint follows the water. The first measurements are indoor: relative humidity readings in several rooms, at several times, since a single reading at the thermostat flatters the story. The second look is at the equipment's drying setup — system size against the home's actual load, airflow across the coil, cycle length on a typical afternoon, and the condensate drain's condition and output. The third look is at the sources: crawl space or basement moisture, bathroom and kitchen exhausts that vent into attics instead of outdoors, plumbing weeping quietly somewhere, grade and gutters delivering rainwater to the foundation. Only then does the remedy conversation make sense, because each layer has its own remedy — equipment setup, dedicated dehumidification, ventilation correction, source control — and prescribing from one layer for a problem living in another is how humidity complaints survive multiple service visits.
Count the load the way the coil experiences it: through the humid months, each pass of indoor air delivers moisture that must condense and drain before the air can feel finished. In Charleston, where cooling degree days reach 2,434 a year, that invisible water work rivals the temperature work the system was named for.
There is a daily rhythm to the complaint that helps diagnose it. Rooms that diverge mostly in the afternoon are reporting solar load and roof heat; rooms that diverge all day are reporting delivery; a house whose floors swap roles between summer and winter — upstairs hot in July, downstairs cold in January — is reporting stack effect and a single system asked to average two buildings' worth of physics. In Charleston all three rhythms run through the housing stock, sorted loosely by plan and era: the two-storey colonials of the growth decades, the sprawling single-level homes whose far wings were always a duct run too far, the renovated houses whose additions rewrote the load map without rewriting the network. Naming the rhythm correctly is most of the work; the remedy, once the name is right, is usually obvious to homeowner and technician alike.
Airflow is the substrate everything else stands on, and its rules are unforgiving. A blower moves a volume of air against the network's resistance; lengthen a run, crush a section, close registers, or clog the path and the volume redistributes itself according to physics, not intention — favoring short, wide, open paths and starving long ones. Balancing is the craft of arranging that redistribution deliberately: damper positions, register adjustment, return paths sized for the supply they serve. In a Charleston home the balance drifts over the years as filters load, furniture rearranges the rooms' air, renovations close paths that used to be open, and duct sections sag or separate. A system can therefore be out of balance without anything being broken — which is both the good news and the diagnostic difficulty, since the remedy is a methodical walk of the whole network rather than a replaced part.
The climate record sets the pattern's stakes in Charleston: 2,434 cooling degree days load the upper floors through the summer while 1,844 heating degree days expose the far rooms all winter. A house with an unsorted delivery map is audited at both ends of the year — the pattern is not seasonal, it is structural, and the seasons merely take turns proving it.
There is a paperwork side to the transition that touches Charleston homes quietly. Refrigerant work is regulated work: recovery, handling and record-keeping rules apply to whoever services a system, and the newest refrigerants — mildly flammable by classification — arrive with their own sensors, labeling and code provisions that installers must follow. For the homeowner the visible part is small: a nameplate with a different designation, a technician explaining why a charge is measured and documented as it is, an installation that includes leak-detection provisions the older system never had. The invisible part matters more over time: as the newest generation becomes the metro's standard, parts, training and service practice consolidate around it, and the older generations become the specialty work. Owning an older-generation system is not a fault — but its service ecosystem is, year by year, becoming a smaller room.
A transition-aware service visit has a recognizable order. First, identification: the nameplate's refrigerant, model and year, stated aloud so the household and technician share the fact. Second, the leak question, taken seriously — a system low on charge has a leak until proven otherwise, and recharging without finding it is buying the same refrigerant twice on an installment plan. Third, the condition audit around the failure: compressor health, coil condition, electrical wear, because the decision the household faces is about the whole machine, not the one part that stopped. Fourth, the comparison itself, presented as what it is — the repair path with its realistic horizon, the replacement path with its — so the choice is made on the machine's merits and the household's plans for the home. In Charleston that conversation, held in a calm season, is unhurried and genuinely optional-feeling; held in a heat wave, the same facts arrive wearing a deadline.
Count the generations the way a technician's route does: a single Charleston street can hold an R-22 veteran, two R-410A systems and a current-generation installation within a few doors. The service records of one metro contain the whole transition — which is why identification, not assumption, opens every diagnosis here.
The cruelest feature of heat failure is its scheduling. A Charleston air conditioner under extreme load does not stop on a mild morning; it stops at the peak of the hottest afternoon, when every other strained system in the metro is stopping too. The parts it needs, the symptoms it shows and the questions a technician asks are all shaped by that timing. Households that know their system's age and service history answer those questions faster and get a better-matched visit. The heat itself is forecast days ahead; the strain it will apply is the most predictable workload in the home's year, and the systems that come through it are the ones whose wear items were renewed before the forecast, not after the failure.
The physics underneath is simple enough. An air conditioner does not create cold; it moves heat from indoors to outdoors, and it moves that heat against the temperature difference between the two. The hotter it is outside, the harder the compressor must work to push heat uphill, and the longer the system must run to hold the same indoor temperature. In Charleston the design assumptions behind older systems were written for a milder version of this contest. A unit installed when the surrounding streets were newer now serves a home with more heat gain — mature trees gone or grown, additions built, attic insulation settled — while its own capacity has thinned with age. The gap between what the house asks and what the unit can give widens a degree at a time, and extreme heat is when the gap becomes a number the thermostat reports every afternoon.
The climate record makes the pattern's case on its own: 64.3 days a year at 90 degrees or more at CHARLESTON INTL AP, SC US, stacked into a season of 2,434 cooling degree days. Every system in Charleston sits that examination; the ones that fail it are the ones whose wear items were already spent when the heat arrived.
Twice a year, Charleston changes its mind. The shoulder seasons — the weeks when a house can need heating in the morning and cooling by afternoon, sometimes within the same day — ask more of a system and its household than either deep season does: both modes in working order at once, controls set for change rather than for a settled pattern, and equipment that may sit idle for stretches and then be called on without ceremony. The record at CHARLESTON INTL AP, SC US frames the workload honestly — 1,844 heating degree days against 2,434 cooling degree days, a genuinely two-season climate — and the shoulders are where the two halves meet and negotiate. The checks that matter are changeover checks: the season just ending reviewed for what it spent — the filter, the wear items, the symptoms it filed — and the season arriving proven before it is needed, with a full run in the new mode while the weather is still forgiving. The thermostat's program belongs in the same check; last season's schedule, carried forward unexamined, is how a house ends up heating against an open-window afternoon. Households that treat the shoulders as their maintenance seasons get two calm, well-timed looks at their system a year — which is exactly the rhythm the equipment's manufacturers had in mind.
The season loads Charleston's systems the way its record at CHARLESTON INTL AP, SC US says it will: 1,844 heating degree days against 2,434 cooling degree days in an average year, against a housing stock whose median build year is 1995. The households that read the season early — filters, drains, a system run before the extreme weeks — are the ones whose calls stay schedulable.
Look deeper and the humidity story in Charleston is partly a story about how houses changed. Older homes here breathed loosely and dried by accident; their moisture escaped through the same leaks that admitted it. Modern weatherization tightened the envelope — correctly, for energy — but a tight house keeps its moisture as faithfully as it keeps its conditioned air, and the drying that used to happen by leakage must now happen by design. Many Charleston homes sit between the two eras: partly tightened, partly original, with cooling equipment asked to mediate. Their humidity complaints are era complaints — the house was changed faster than its moisture plan was. The resolution is not to loosen the house again but to finish the design: deliberate ventilation, deliberate dehumidification, and a cooling cycle set up to dry. The metro's housing stock, read closely, is a museum of this transition, and its sticky rooms are the exhibits still awaiting their captions.
The numbers underneath it, for Charleston: 370,246 housing units, a median build year of 1995, and a climate record at CHARLESTON INTL AP, SC US of 1,844 heating degree days against 2,434 cooling degree days. Cross the housing record with the weather record and this pattern is what falls out at the top — rarely the most dramatic problem in heating and cooling, but the one this metro's stock and climate manufacture most steadily.
Experienced local practice starts with the simple certainties — the observations that take minutes and decide the most:
Listed in the order this metro's housing and climate data supports.
Three parts, one system: filtration captures what the air carries, humidity control keeps moisture where the building tolerates it, and ventilation replaces stale air on schedule. Equipment chosen for one part cannot do the others' work.
The air quality conversation in Charleston starts with humidity more often than with gadgets. A home whose summer indoor humidity rides high grows musty at the coil and uncomfortable at the thermostat, and a home dried out by 1,844 heating degree days of winter runtime irritates skin, wood and sinuses in the opposite direction. The assessment measures before it prescribes: humidity in both seasons, the filter's actual condition and fit, the duct leakage that pulls attic or crawl-space air into the supply stream in the metro's older districts. In Charleston that holds across 47 ZIP codes, from Charleston out to Mount Pleasant.
The local figures behind the service: 327,420 households, indoor humidity driven by 52.51 inches of yearly rain and long humid stretches, pollen seasons that load every return in Berkeley County. The assessment measures a home against exactly that climate, not against a generic standard.
A mini-split heats as completely as it cools; in Charleston the cold-climate models' published low-temperature figures decide whether a room can retire its old heaters or keeps them as support.
Ductless systems find their Charleston homes where ductwork never went: the older districts' additions and converted spaces, the pre-1960 homes — 10.1% of the metro — built around boilers or gravity heat, the workshops and finished basements of the growth suburbs. A mini-split heats and cools a defined space without asking the house to grow ducts, which is why the assessment starts with the space itself: its exposure, its insulation era, how it is actually used across 64.3 hot days and the winter's coldest weeks. Locally the workload concentrates where the stock is oldest — the districts built around the 1990s first.
Scale the question by the Census count and it stays concrete: 370,246 housing units, a share of them holding rooms — additions, conversions, finished spaces — that no duct serves. The mini-split visit exists to give one of those rooms its own climate, sized to its exposure and use.
The local professional you are connected with reads the system the way it fails: electrical values first, then temperatures and pressures, then airflow, until one finding explains all of the symptoms at once.
Air conditioning in Charleston works against the local calendar: 2,434 cooling degree days a year at CHARLESTON INTL AP, SC US, with 64.3 days at 90 degrees or more. The failures follow that load — capacitors and contactors worn by relentless summer cycling, refrigerant charges drifting low on systems that have served a decade of heat, condensate drains clogging in the humid weeks. The older districts run the oldest condensers; the subdivisions around Charleston run matched fleets installed in the same seasons, and both sides of the metro meet the repair call on the hottest week of the year. It is why two Charleston homes of the same age, on different streets, so often need the same visit in the same year.
Count the exposure from the Census side: a median build year of 1995 across 370,246 housing units means half the metro's air conditioners are older than the systems in the growth suburbs around Hanahan, and summer runtime is the statistic that matters — the repair calls follow it street by street.
Across Berkeley, Charleston, Dorchester, the cleaning question is answered the same way — look inside first. From Charleston out through the 47 ZIP codes covered, matted buildup and renovation debris make the case; a light film makes the case for waiting.
From Charleston to Summerville, Charleston replacements routed through TempReach USA end in commissioning — measured charge and airflow — so the installed system matches the calculated one.
Across 47 ZIP codes, Charleston heating stock reflects a median build year of 1995 — furnaces at every age, each diagnosed on its own sequence and condition rather than its birthday.
With 370,246 homes and a median build year of 1995, Charleston heating stock spans every era of furnace and flue — each installation assessed on its own house, not on the outgoing unit's label.
Heat pump services in Charleston test the whole year-round system: the independent local professional covering Berkeley, Charleston, Dorchester reads charge and airflow in both modes, proves defrost, and checks auxiliary heat logic before quoting any work.
In Charleston, the thermostat question splits by housing era: homes from around the median build year of 1995 often lack a common wire in the wall, while newer builds across the 47 covered ZIP codes usually carry one — the local professional checks the cable before choosing the control.
In Charleston, the maintenance calendar writes itself from the climate: 1,844 heating degree days and 2,434 cooling degree days mean both systems work a real season, so the fall and spring visits each have genuine work to inspect.
Across Berkeley, Charleston, Dorchester, the local professional who answers knows the stock — a median build year of 1995 across 370,246 homes means systems of every age failing in their characteristic ways, from Charleston to the metro's newest subdivisions.
Across Berkeley, Charleston, Dorchester, one climate ledger drives the calendar: 1,844 heating degree days and 2,434 cooling degree days mean roof units work both seasons hard, so the spring and fall visits each carry a full checklist here.
Two patterns generate most of the bookings behind the services above: Humidity burden on homes and cooling systems and uneven temperatures and airflow across the house. That is why the order of this page's service list is what it is — the services answering those patterns come early, and the rest follow in the order the metro's data supports. A homeowner whose home matches the local profile — built in the metro's big decades, in one of its older districts — is, statistically, reading their own shortlist.
PROBLEM SOLUTION
Population 152,014
Population 117,460
Population 92,662
Population 51,262
Population 46,964
Population 21,119
Population 16,261
Population 14,362
Population 11,738
Population 8,517
Population 5,330
Population 4,350
Also in the Charleston metro: Ravenel (population 2,594), Kiawah Island (population 2,196).
Read the grid as a building programme spread over a century. The oldest communities sit where the metro began; the youngest are still adding streets at its edge; and North Charleston and Mount Pleasant, with 117,460 and 92,662 residents, stand for the rings in between. Each ring was fitted in its era's equipment, and each is now failing, wearing or holding in its era's characteristic order. The ZIP codes below draw the coverage boundary; the eras inside it draw everything else on this page — the problems ranked, the services ordered, the checks advised.
Beyond the largest communities sit Summerville (51,262), Goose Creek (46,964), Hanahan (21,119), Ladson (16,261), Moncks Corner (14,362) — smaller places across Berkeley, Charleston, Dorchester, covered on the same terms. Their housing tends to be older on average than the big suburbs', and their calls follow the older patterns on this page. One routing covers them all: find your ZIP code below and the rest is a phone call.
Charleston (152,014 residents) anchors the metro, and North Charleston (117,460) is its second centre of gravity. Between them they hold the bulk of the 327,420 households — and, not coincidentally, the bulk of every housing era this page discusses, from the pre-1960 core to the newest subdivisions. Mount Pleasant (92,662) and the communities beyond it repeat the same eras at smaller scale.
The metro answers to 3 county governments (Berkeley, Charleston, Dorchester), a patchwork that matters at permit time rather than at the thermostat. Berkeley County carries the centre; the others carry the growth rings and the older outlying towns. A technician routed through this page works inside that patchwork daily — the weather does not care about the boundaries, but the job's paperwork does.
This page ends at the metro boundary, but the region does not: Hilton Head Island, SC, Florence, SC and Myrtle Beach, SC continue the coverage in their own directions, each with a profile built from its own Census and NOAA figures. If your home sits near the line between metros, go by your ZIP code — it places you in the dataset that describes your housing.
The region around Charleston is a set of variations on its theme: Hilton Head Island, SC, 62 miles off, runs a median build year of 1998 on a metro population of 242,966; Florence, SC (81 miles) medians 1984 on 201,392; Myrtle Beach, SC (89 miles) medians 1998 on 427,551. Nearness is not sameness — a few decades of median build year separate their heating and cooling as surely as the miles separate their maps.
Count the metro per unit of itself: 7,878 housing units per covered ZIP code; 109,140 households per county; 14 communities sharing 3 county governments. Then weigh the generations against each other — 0.7 older homes for each newer one — and the service pattern on this page stops being a list and becomes a proportion: that much of the diary written by ageing systems, the rest by young ones wearing in.
One line of Charleston arithmetic — a median home 31 years old · 224,938 owner-occupied homes against 102,482 renter-occupied · 796 pre-1960 homes for every covered ZIP code · a heating-to-cooling degree-day ratio of 0.76 · 1,334 mm of rain in an average year.
County pages carry the local detail — land area, climate normals and the heating and cooling pressures on the ground in each county.
More plain-language help: the TempReach USA heating & cooling guides
One call connects you with an independent local heating and cooling professional serving Charleston and the surrounding metro.
Call center hours: Mon-Fri 7:00 AM-10:00 PM ET | Sat 8:00 AM-10:00 PM ET | Sun 7:00 AM-9:00 PM ET