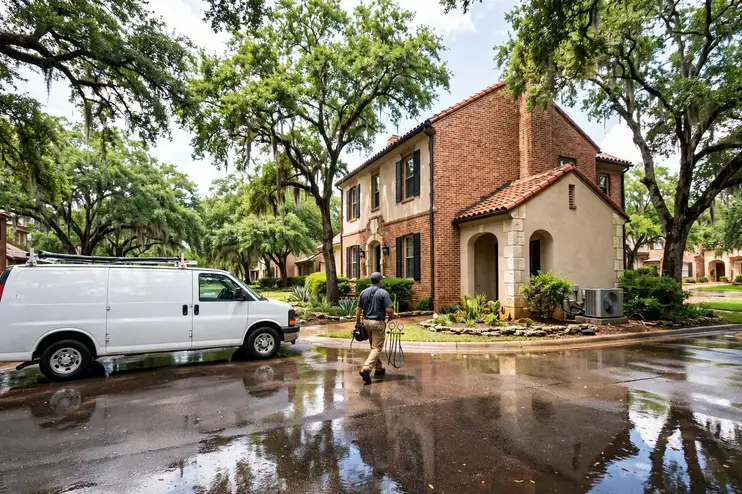


Everything on this page was computed for San Antonio and nowhere else: the problem ranking from its Census housing profile, the seasonal risks from its NOAA station record, the coverage from its own ZIP codes. TempReach USA connects you to an independent local HVAC technician; the page itself is the homework, done in public, so the call you make is an informed one.
Call center hours: Mon-Fri 7:00 AM-10:00 PM ET | Sat 8:00 AM-10:00 PM ET | Sun 7:00 AM-9:00 PM ET
The median San Antonio home was built in 1992; 33.9% of the stock predates 1980, and the pattern this metro's own data ranks first is air conditioners overworked by extreme heat. TempReach USA is a referral service, not an HVAC company: one call connects you with an independent local HVAC technician serving your ZIP code.
Two numbers frame everything that follows: 63.5% of San Antonio homes are owner-occupied, and the median one was built in 1992. Ownership matters to HVAC because owners inherit their systems whole — every equipment decision a builder made in the 1990s or earlier is still in the attic, the closet and the side yard, ageing on its original schedule. With 33.9% of homes predating 1980 and 39.8% arriving since 2000, the metro is really two housing stocks sharing one map, and they are taken separately below before the problems are ranked.
Ask how San Antonio's older homes have been kept comfortable and the honest answer is: in pieces. A furnace here, a condenser there, one room's ducts renewed while the rest of the system carries on — across 351,657 pre-1980 homes, the patchwork is the norm rather than the exception. That history is written in the attics of Atascosa County and everywhere else the early stock stands: systems that are part original, part renewed, and entirely individual. It is also why the guidance on this page keeps returning to patterns rather than single faults — in a patchwork system, the pattern is the diagnosis.
Uniformity is the newer stock's defining trait. A subdivision in New Braunfels or Schertz went up in a handful of years, fitted with one generation of equipment, one duct design, one thermostat class. That uniformity writes a calendar the whole street shares: the first heating wave, the first cooling wave, the first questions about refrigerant and charge arrive together, years before the same streets need anything structural. With 39.8% of the metro built since 2000, that calendar governs a large and growing share of San Antonio's HVAC work — predictable work, if a household reads the calendar early.
The weather's part in this is written at SAN ANTONIO INTL AP, TX US, where an average year carries 32.38 inches of precipitation, 122.4 days at ninety degrees or more and 14.0 nights at freezing or below. Systems experience that year as workload and as stakes in roughly equal measure — the workload in the run hours, the stakes on the single coldest night and the single hottest week. The problem ranking further down is simply the housing profile above, read under this sky.
The metro's building eras on one side, its weather record on the other — and its heating and cooling where the two meet.
Break the stock down by building era and the profile sharpens. Before 1960: 14.4% of homes, roughly 149,376 of them. From 1960 to 1979: 19.5%, about 202,281. From 1980 to 1999: 26.3%, about 272,819. Since 2000: 39.8%, about 412,860. Four eras, four equipment generations — and the balance among them is this metro's HVAC character in a single paragraph.
A metro that mostly built itself after 2000 has HVAC with a distinctive trait: uniformity. The same subdivisions, the same system designs, the same installation years — and therefore the same maintenance waves, arriving at the same streets in the same seasons. San Antonio's older pockets still produce the deepest individual jobs, but the volume lives in the new stock: condensers cycling together, thermostats ageing together, heat pump questions surfacing together. Reading those waves early is most of what local knowledge means here.
The runner-up era is 1980-1999, with 26.3% of homes. That stock has left its carefree decades and entered its maintenance decades, and it shows in the call pattern around New Braunfels and the other districts of those years: condensers on their second cycle, furnaces reaching their wear points together, ducts still young enough to reward attention over replacement.
Start the climate half where the system starts: at the thermostat's two seasons. San Antonio's cooling answers 3,148 cooling degree days of load and its heating answers 1,438 heating degree days of cold at SAN ANTONIO INTL AP, TX US — an average temperature of 69.6 degrees that no individual week actually delivers. A heating and cooling system here is never in neutral; the record keeps it working at one end or the other all year.
A profile is only useful if it predicts something, and this one predicts the shape of an HVAC diary in San Antonio: which streets will call about cooling, which about heating, which about airflow, and in which months. Everything after this section is that prediction written out as services, problems and answers — the numbers first, the narrative second, the way the evidence actually runs.
Ordered by what this metro's data says its homes need most.
Refrigerant is never consumed, so a low charge in a San Antonio home means a leak to be found, not just a top-up to be sold; the repair addresses the cause or the symptom is already on its way back.
Air conditioning in San Antonio works against the local calendar: 3,148 cooling degree days a year at SAN ANTONIO INTL AP, TX US, with 122.4 days at 90 degrees or more. The failures follow that load — capacitors and contactors worn by relentless summer cycling, refrigerant charges drifting low on systems that have served a decade of heat, condensate drains clogging in the humid weeks. The older districts run the oldest condensers; the subdivisions around San Antonio run matched fleets installed in the same seasons, and both sides of the metro meet the repair call on the hottest week of the year. The 32.38 inches of rain in an average year here is part of the story too — humidity loads every cooling coil in the metro.
The local caseload behind this service is written in the climate figures: 3,148 cooling degree days a year and 122.4 days at 90 or above, pressing on a cooling fleet whose oldest members serve the 351,657 pre-1980 homes — in New Braunfels (98,700 residents) as much as in the oldest districts.
In San Antonio this service is booked most often through the problem patterns at the top of this page — the metro's housing data, not habit, sets the order. If your home is in the 33.9% built before 1980, mention its age on the call: it changes the parts the technician loads before heading to San Antonio and the rest of the metro.
Moisture cuts both ways. Too little through a heating season cracks wood and dries airways; too much through a cooling season feeds what grows in damp corners. Whole-home control aims at the moving middle, set against the weather outside.
Across San Antonio's 949,097 households, the air quality diary follows the building map. The tight new subdivisions near New Braunfels ask about ventilation and the chemistry of new materials; the the 1990s districts ask about dust, infiltration and the crawl spaces under raised floors; the households in between ask about allergies in the pollen months. One service name, three different sciences — which is why the visit begins with questions about the house and the people in it, not with a product sheet. Locally the workload concentrates where the stock is oldest — the districts built around the 1990s first.
Air quality demand in this metro is written by its sealed seasons: 122.4 hot days with the windows shut around the cooling, 14.0 freezing nights with them shut around the heat. The 412,860 post-2000 homes hold their air tightest; the older districts around Timberwood Park exchange theirs with attics and crawl spaces.
Where this service gets booked in San Antonio follows the map on this page: the older districts generate the deep-end work, the post-2000 subdivisions the wear-and-tear work, and the 272,819 homes in between split the difference. Telling the call center your home's build decade — most San Antonio owners know it within a few years — puts the right kit on the van the first time.
The maintenance rhythm is light but real — washable filters rinsed on cycle, drains checked before they drip — and San Antonio handovers demonstrate it unit by unit rather than mentioning it in passing.
Ductless work in San Antonio also follows the housing nobody else can easily serve: the historic core around San Antonio, where walls were never built for ducts, and the accessory dwellings and in-law spaces appearing across Atascosa, Bandera, Bexar, Comal, Guadalupe, Kendall, Medina, Wilson. Each installation is a small design project — line-set routes, condensate paths, the outdoor unit's placement — fitted to a building that predates the very idea of central air. Done well, the result is the quietest heating and cooling in the house. Ask in Timberwood Park and the answer rhymes with San Antonio: same eras, same equipment generations, same calendar of failures.
The search territory for ductless is the metro's unducted stock: 149,376 pre-1960 homes built before central systems, plus the additions and conversions scattered through 949,097 households — in Canyon Lake and the historic core alike, spaces the main system never reached.
One local habit worth copying: San Antonio homeowners who mention their street's building era when they book get a better-matched visit, because a technician heading to a the 1990s home in Atascosa County loads different parts than one heading to a new-build subdivision in New Braunfels. The service is the same; the preparation is local.
Post-renovation is the clearest case in the trade. Drywall dust and sanding residue settle through every open register, and one thorough cleaning after the work ends removes in hours what the system would otherwise circulate for years.
Duct cleaning in San Antonio is booked in waves that follow the housing: after the renovation seasons in the older districts, at move-in across the subdivisions, alongside system replacements everywhere. The work pairs naturally with the inspection that surrounds it — leaking joints found and sealed, a disconnected run in an attic discovered, insulation fallen where it should not be. The cleaning is the appointment; the findings are often the value. That is the daily reality for the 949,097 households spread across Atascosa, Bandera, Bexar, Comal, Guadalupe, Kendall, Medina, Wilson.
Duct demand concentrates in the metro's long-biography homes: 351,657 pre-1980 systems that have carried decades of household air, and the renovated homes around Converse (28,764 residents) whose construction dust is still in the runs.
In San Antonio this service is booked most often through the problem patterns at the top of this page — the metro's housing data, not habit, sets the order. If your home is in the 33.9% built before 1980, mention its age on the call: it changes the parts the technician loads before heading to San Antonio and the rest of the metro.
With a median build year of 1992, many San Antonio systems are reaching replacement age together; the professional you are connected with inspects ducts and electrics across 121 ZIP codes before recommending equipment.
Across 121 ZIP codes, San Antonio heating stock reflects a median build year of 1992 — furnaces at every age, each diagnosed on its own sequence and condition rather than its birthday.
Heating installation in San Antonio starts with a heat-loss calculation across Atascosa, Bandera, Bexar, Comal, Guadalupe, Kendall, Medina, Wilson: the independent local professional measures the home's loss, inspects ducts and venting, and quotes the full scope before work begins.
Heat pump services in San Antonio test the whole year-round system: the independent local professional covering Atascosa, Bandera, Bexar, Comal, Guadalupe, Kendall, Medina, Wilson reads charge and airflow in both modes, proves defrost, and checks auxiliary heat logic before quoting any work.
Across Atascosa, Bandera, Bexar, Comal, Guadalupe, Kendall, Medina, Wilson, one climate fact shapes the configuration: 1,438 heating degree days against 3,148 cooling degree days tells whether the control's year is mostly a heating story, mostly a cooling story, or a genuine heat pump balancing act.
Across Atascosa, Bandera, Bexar, Comal, Guadalupe, Kendall, Medina, Wilson, the service record is the scarcest asset: with a median build year of 1992 across 1,037,336 homes, many systems around San Antonio have no documented history — and a first tune-up's baseline is what every later decision stands on.
Across Atascosa, Bandera, Bexar, Comal, Guadalupe, Kendall, Medina, Wilson, the local professional who answers knows the stock — a median build year of 1992 across 1,037,336 homes means systems of every age failing in their characteristic ways, from San Antonio to the metro's newest subdivisions.
San Antonio's commercial buildings span every era around a median build year of 1992 — and with the era goes the equipment, from aging single units over old storefronts to multi-zone systems in new developments, all serviced from a per-unit record.
Ask where this metro's HVAC diary fills up and the answer is a short story: Air conditioners overworked by extreme heat first, humidity burden on homes and cooling systems close behind, and the services that answer them doing the bulk of the booked work. Everything else on the list above is the supporting cast — necessary, frequent enough, but not what San Antonio's housing stock, at its age and in its climate, principally demands. Read the service list as a weather report for the metro's systems and it stops looking like a catalogue.
Ranked for this metro alone, from its Census housing profile and NOAA climate record.
The cruelest feature of heat failure is its scheduling. A San Antonio air conditioner under extreme load does not stop on a mild morning; it stops at the peak of the hottest afternoon, when every other strained system in the metro is stopping too. The parts it needs, the symptoms it shows and the questions a technician asks are all shaped by that timing. Households that know their system's age and service history answer those questions faster and get a better-matched visit. The heat itself is forecast days ahead; the strain it will apply is the most predictable workload in the home's year, and the systems that come through it are the ones whose wear items were renewed before the forecast, not after the failure.
The physics underneath is simple enough. An air conditioner does not create cold; it moves heat from indoors to outdoors, and it moves that heat against the temperature difference between the two. The hotter it is outside, the harder the compressor must work to push heat uphill, and the longer the system must run to hold the same indoor temperature. In San Antonio the design assumptions behind older systems were written for a milder version of this contest. A unit installed when the surrounding streets were newer now serves a home with more heat gain — mature trees gone or grown, additions built, attic insulation settled — while its own capacity has thinned with age. The gap between what the house asks and what the unit can give widens a degree at a time, and extreme heat is when the gap becomes a number the thermostat reports every afternoon.
The climate record makes the pattern's case on its own: 122.4 days a year at 90 degrees or more at SAN ANTONIO INTL AP, TX US, stacked into a season of 3,148 cooling degree days. Every system in San Antonio sits that examination; the ones that fail it are the ones whose wear items were already spent when the heat arrived.
Ask where a home's humidity actually comes from and the answers are a census of ordinary life: showers, cooking, laundry, breathing, houseplants, a damp crawl space exhaling through the floor, rain finding the grade against the foundation. In San Antonio the outdoor air itself joins the census for much of the year, entering through every leak in the envelope and every return-duct path that crosses a humid space. The air conditioner is expected to process the sum of it. That expectation is reasonable only when the system's drying capacity is matched to the load — and the load is a property of the house and its climate together, which is why two identical systems on the same street can leave one house crisp and another sticky: the houses are importing different amounts of water, and only one system's setup accounts for it.
The physics of the burden are worth stating plainly. Air holds water as vapor; the amount it can hold rises with temperature, which is why warm air arriving in a San Antonio summer carries so much of it indoors. A cooling coil removes moisture by passing air across a surface cold enough for water to condense on it — the same physics that beads a cold glass. Two conditions govern how much condenses: how long the air stays against the cold coil, and how cold the coil runs. Short cycles starve the first; high airflow can starve the second. Meanwhile the house keeps adding vapor from living and from its own damp places, and the envelope keeps trading air with the outdoors. Indoor humidity is the running balance of that account — removal by the coil against addition by everything else — and a house that feels damp is simply a house whose account is out of balance in the wet direction.
The timing is the signature: humidity complaints in San Antonio peak in the wet, saturated stretches rather than the hottest dry ones — the pattern of a moisture load, not a temperature load, announcing itself through the same equipment.
Planning is where households regain the advantage. A San Antonio homeowner who knows their system's refrigerant, age and repair history can run the transition on their own schedule: service the current machine properly, watch the leak-and-wear indicators, and time any replacement for a shoulder season, chosen equipment and an unhurried installation. The homeowner who meets the transition for the first time through a breakdown meets it on the calendar's worst terms — mid-heat, limited deliberation, a decision between an expensive charge on an old machine and a replacement nobody had budgeted to choose that week. The transition itself is the same in both stories; the difference is purely when the household chose to read the nameplate. Technicians in this metro can recite both versions from memory, street by street, because the metro's equipment generations were installed street by street.
Judge a refrigerant-era system by its leak history and its trend, not by a single charge reading. One low reading after many tight years is an event; a pattern of small losses is a biography, and the biography is what the economics should be based on. San Antonio's climate record loads the question at both ends — a leaking system underperforms exactly when SAN ANTONIO INTL AP, TX US's 122.4 hot days demand its full capacity, and its owner pays for refrigerant and lost performance simultaneously. The households that navigate this transition well keep one habit: they can state their system's age, refrigerant and last three repairs without looking them up. That small command of the facts converts an industry-wide generational change into a single household's managed decision, which is the scale at which it was always going to be decided anyway.
The climate loads the stakes: a leaking system in San Antonio underperforms through 122.4 days a year at 90 degrees or more at SAN ANTONIO INTL AP, TX US, so the household pays the transition's toll twice — in refrigerant and in lost cooling — until the underlying decision is made.
One thermostat, one system, and a house that cannot agree on the temperature: the upstairs bakes while the downstairs needs a sweater, the addition never matches the original rooms, the far bedrooms run their own climate entirely. In San Antonio this is among the most common comfort complaints in larger and multi-storey homes, and among the most misdiagnosed, because the equipment is usually innocent. A single system delivers air according to its duct network's design and its thermostat's location — and the thermostat only reports its own room. Floors gain heat differently, sun loads rooms differently by the hour, and duct runs deliver unevenly by length and condition, so the house's rooms drift apart while the system reports success at the one point it measures. The answers live at three levels: airflow correction in the existing network, zoning that lets one system serve areas on separate calls, and ductless equipment that gives the problem rooms their own dedicated capacity. Which level fits depends on how far apart the rooms are, and why — a diagnosis question before it is an equipment question.
Judge a multi-room home at its extremes, not at its thermostat. The thermostat sits, by convention, in the home's most average room, and it will report contentment while the nursery roasts and the end office freezes. The extremes are the system's true report card, and in San Antonio they follow the climate record honestly: 122.4 hot days audit the upstairs, 14.0 freezing nights audit the far rooms over unheated spaces, and the household learns its home's real climate map from the rooms it avoids in each season. Homes whose extremes are comfortable have been sorted — by design, by correction or by dedicated equipment — and homes whose extremes are endured are carrying an unsorted map. The sorting is a solvable problem in essentially every case; what it cannot survive is being mistaken for an equipment failure and treated with a bigger version of the same single answer.
Look at the adaptation evidence in any affected San Antonio home: the portable heater in the end room, the fan that lives in the upstairs hall, the bedroom doors propped for airflow. Households instrument this pattern with their own purchases long before anyone measures it — the adaptations are the data, waiting for a diagnosis.
The rooms tell the story before any instrument does. In a San Antonio home with tired ductwork, the pattern is geographic: the rooms nearest the air handler are comfortable, the far rooms lag, and the rooms over the longest or leakiest runs barely participate. Households adapt without noticing — a fan in the far bedroom, a space heater in the end office — treating as architecture what is actually plumbing for air. Duct runs installed in the metro's big building decades have now spent years in attic heat and crawl-space damp; flex sections sag, inner liners tear, and connections at the plenum work loose a fraction with every season's expansion and contraction. The equipment cycles faithfully and the house still under-delivers, because a system can only condition the air that actually arrives.
The construction details explain the timeline. Duct joints are mechanical connections, and the sealants asked to make them permanent have finite lives: cloth-backed tape dries and releases, foil tape lifts at edges, and even mastic can crack where runs move with the building. Flex duct, common in the metro's later building decades, fails at its connections and where its inner liner is pierced or crushed — and a crushed section quietly throttles every room downstream of it. Meanwhile the spaces the ducts cross work against them: attic temperatures in a San Antonio summer turn an uninsulated or leaking run into a heat exchanger pointed the wrong way, and winter reverses the argument in the crawl space. A duct system is therefore not a fixed asset but a slowly changing one, and its delivered performance in any given year is an empirical question, not a memory of its installation day.
Consider the delivery assumption: every system in San Antonio was sized on the expectation that its air would arrive. With 33.9% of homes built before 1980 — and their networks renovated, extended and re-sealed by turns ever since — that expectation's reliability varies house by house, which is why the measurement, not the assumption, has to govern.
Preparation for a San Antonio summer is a short list done before the heat makes it urgent: clear the outdoor unit's breathing room, renew the filter, flush the condensate line, and give the system one full-load rehearsal while a repair, if it needs one, is still a scheduled visit rather than a heat-wave call. The record at SAN ANTONIO INTL AP, TX US — 122.4 days a year over 90 degrees — is the schedule the season will keep; the systems that meet it with clean coils and healthy starting components treat it as a routine, and the ones that meet it carrying spring's neglect meet it as an examination.
The season loads San Antonio's systems the way its record at SAN ANTONIO INTL AP, TX US says it will: 1,438 heating degree days against 3,148 cooling degree days in an average year, against a housing stock whose median build year is 1992. The households that read the season early — filters, drains, a system run before the extreme weeks — are the ones whose calls stay schedulable.
The deep structure of heat failure in San Antonio is generational. Equipment installed in the same building boom ages on the same schedule, so whole streets approach the wear limits of their starting components together. The climate record at SAN ANTONIO INTL AP, TX US supplies the trigger — the season's hottest stretch — and the housing record supplies the candidates: the 351,657 pre-1980 homes whose systems have been replaced at least once already, and the newer stock whose first systems are arriving at the same age simultaneously. Neither record alone predicts the call map; read together, they predict it street by street. That is why local experience in this metro is genuinely local knowledge: the technician who has worked its booms knows which generation of equipment each district is spending this summer.
Strip the pattern down to its inputs and the ranking stops being mysterious: 949,097 households depending on systems installed across a median build year of 1992, in a climate that swings between 122.4 days of serious heat and 14.0 freezing nights. Whatever pattern a metro with those inputs manufactures most, it manufactures here — the lead position is less a title than a consequence, recalculated from the same public records any sceptic can check.
Experienced local practice starts with the simple certainties — the observations that take minutes and decide the most:
PROBLEM SOLUTION
Population 1,458,954
Population 98,700
Population 43,128
Population 34,980
Population 33,829
Population 32,924
Population 31,789
Population 28,764
Population 19,853
Population 19,509
Population 15,875
Population 11,479
Also in the San Antonio metro: Selma (population 11,302), Pleasanton (population 10,854).
Read the grid as a building programme spread over a century. The oldest communities sit where the metro began; the youngest are still adding streets at its edge; and New Braunfels and Schertz, with 98,700 and 43,128 residents, stand for the rings in between. Each ring was fitted in its era's equipment, and each is now failing, wearing or holding in its era's characteristic order. The ZIP codes below draw the coverage boundary; the eras inside it draw everything else on this page — the problems ranked, the services ordered, the checks advised.
Also on the San Antonio map: Timberwood Park (34,980), Cibolo (33,829), Canyon Lake (32,924), Seguin (31,789), Converse (28,764) — communities spread across Atascosa, Bandera, Bexar, Comal, Guadalupe, Kendall, Medina, Wilson, each with housing from its own growth years. A technician routed through TempReach USA to any of them is working from this same page: the metro data does not change at the city limit, but the housing on your street — its age, its equipment, its attic — is what the visit is really about.
The metro's weight is not evenly spread. San Antonio holds 1,458,954 of the 2,612,802 residents; New Braunfels and Schertz add 98,700 and 43,128; and the remainder scatters across the smaller places above, some no bigger than a few thousand people. HVAC follows the weight — most calls come from where most homes are — but era matters more than size: a small community of 1960s housing generates older-system work than a large new subdivision does.
Draw the metro by its paperwork and it resolves into Atascosa, Bandera, Bexar, Comal, Guadalupe, Kendall, Medina, Wilson — 8 jurisdictions sharing one housing stock and one weather system. Atascosa County holds the historic centre and the densest share of the older homes; the surrounding counties hold the rings of growth around it. Permits and inspections follow those boundaries even though temperature never does, which is part of why the technician this page connects you to works these streets specifically.
This page ends at the metro boundary, but the region does not: Austin, TX, Killeen–Temple, TX and Laredo, TX continue the coverage in their own directions, each with a profile built from its own Census and NOAA figures. If your home sits near the line between metros, go by your ZIP code — it places you in the dataset that describes your housing.
Set San Antonio among its neighbours and the contrasts sharpen the profile: Austin, TX — metro population 2,620,945, median build year 2000 — sits 72 miles away; Killeen–Temple, TX (511,497, median 1993) 126 miles; Laredo, TX (281,224, median 1996) 129 miles. Three different housing stocks under three nearby skies, which is why each keeps its own page and its own problem ranking rather than borrowing this one.
Count the metro per unit of itself: 8,573 housing units per covered ZIP code; 118,637 households per county; 14 communities sharing 8 county governments. Then weigh the generations against each other — 0.9 older homes for each newer one — and the service pattern on this page stops being a list and becomes a proportion: that much of the diary written by ageing systems, the rest by young ones wearing in.
San Antonio by the derived numbers — median home age 34 years · owners in 602,677 homes, renters in 346,420 · each covered ZIP code carrying about 1,235 pre-1960 homes · a heating-to-cooling degree-day ratio of 0.46 · 822 mm average annual rainfall.
County pages carry the local detail — land area, climate normals and the heating and cooling pressures on the ground in each county.
More plain-language help: the TempReach USA heating & cooling guides
Describe the problem and the call center routes you to an independent local HVAC technician who works in the San Antonio metro.
Call center hours: Mon-Fri 7:00 AM-10:00 PM ET | Sat 8:00 AM-10:00 PM ET | Sun 7:00 AM-9:00 PM ET