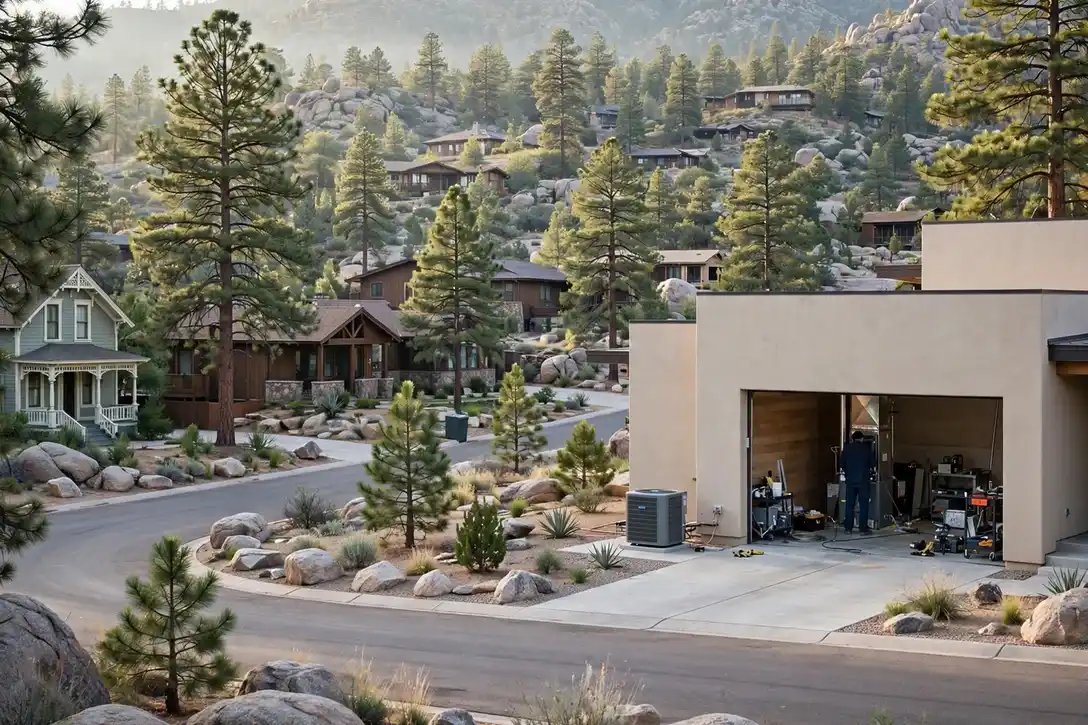


This is Prescott's heating and cooling page, built from Prescott's own numbers: Census housing figures, the metro's ZIP codes and its NOAA climate record. TempReach USA routes your call to an independent local HVAC technician; the homework below is here so you know your home's likely problems before you ever make it.
Call center hours: Mon-Fri 7:00 AM-10:00 PM ET | Sat 8:00 AM-10:00 PM ET | Sun 7:00 AM-9:00 PM ET
The median Prescott home was built in 1994; 23.5% of the stock predates 1980, and the pattern this metro's own data ranks first is the refrigerant transition reaching older systems. TempReach USA is a referral service, not an HVAC company: one call connects you with an independent local HVAC technician serving your ZIP code.
Prescott is a metro of 241,656 people and 108,900 households, and its heating and cooling is a portrait of its building history. The median home here was built in 1994; 23.5% of homes predate 1980 and 5.6% predate 1960, while 36.3% have arrived since 2000. Every one of those eras heated and cooled differently — different furnaces, different duct designs, different refrigerant generations — and they fail differently, which is why this page is organised around the patterns the data actually produces in Prescott rather than HVAC in the abstract.
Stand in one of Prescott's older neighbourhoods and you are standing in its HVAC's back catalogue. The homes there — part of the 29,148 built before 1980 across this metro — went up when a furnace was built to serve for a generation and central cooling was still spreading street by street. That generation has now elapsed several times over. What it leaves behind is not universal failure but universal exposure: every duct joint, igniter and condenser coil in those districts is operating past the horizon its makers planned for, in Yavapai County and beyond, and the failures arrive in the order the parts tire.
The newer side of Prescott — the 36.3% of homes built since 2000, concentrated around growing communities like Prescott Valley — runs on matched modern systems that age more gracefully but fail in their own ways: heat pumps and condensers worked hard by 1,068 cooling degree days of hot-season demand, control boards and sensors wearing out in houses that all reach the same age at the same time. One metro, two equipment generations, and the sections below take them in the order this metro's data ranks them.
One more record sits over the whole metro, and it is the one the equipment itself keeps: the weather's. PRESCOTT LOVE FLD, AZ US logs 12.85 inches of precipitation in an average year and swings between 50.4 days at 90 degrees or more and 113.0 nights at or below freezing. Heating systems ride that swing in their run hours; cooling systems ride it in their cycle counts; ducts ride it in the attics, expanding and contracting between the seasons. Cross the swing with the housing ages above and the selection of problems further down this page stops looking like a list and starts looking like an arithmetic result.
Housing eras and climate, joined — the two datasets every section of this page is built from.
The distribution, in one breath: of every hundred Prescott homes, 5.6 were standing before 1960, 17.9 went up in the two decades after, 40.2 in the two after that, and 36.3 have arrived since 2000. Percentages flatten the picture, so hold the counts beside them — 6,946 oldest-era homes, 45,024 newest — and the metro's heating and cooling stops being an abstraction: it is that many systems, of those ages, failing in that order.
The metro's HVAC present was installed between 1980 and 1999, and it is ageing as a cohort. That cohort's traits are consistent: sound bones, wearing surfaces. The systems beneath these homes are not failing from ancient design but from the accumulated cycles of two to four decades — and the work they generate is the steady, schedulable kind, provided it is scheduled. Left alone, cohort ageing has a way of arriving all at once; attended to, it is the most manageable profile a metro can have.
The second-largest band is the newest: 45,024 homes built since 2000, 36.3% of the metro. Young stock writes young HVAC — condenser waves, control waves, the first heat pump questions — arriving street by street as uniform subdivisions age in lockstep around Prescott and the growth edge. It is the metro's future workload, visible early to anyone reading the table.
The climate half of the profile, from PRESCOTT LOVE FLD, AZ US: 4,056 heating degree days against 1,068 cooling degree days, 12.85 inches of precipitation, an average temperature of 56.7 degrees. Read together, those figures describe the loads: how many hours a furnace runs in a year, how relentlessly a condenser cycles through summer, how much moisture the cooling coil must pull from the air — 113.0 nights at or below freezing, against 50.4 days at 90 or above.
Hold the two halves together and the rest of this page explains itself: the problems ranked highest here are the ones where Prescott's dominant housing era and its climate record overlap. Change either dataset and the ranking changes — which is precisely why this profile is rebuilt from the records for every metro instead of carried over from the last one.
Chosen by this metro's own housing and weather data — the same two records this whole page is built from.
Leaks are where the transition stops being abstract. A slow leak on a current-generation system is an ordinary repair story: find it, fix it, recharge. The same leak on an R-22 system in Prescott opens a ledger. The refrigerant itself is drawn from a shrinking reclaimed supply; the system is, by definition, of an age where the leak may not be its last; and the money spent returning it to service buys time on a machine whose other components have aged alongside it. None of that decides the answer by itself — plenty of R-22 systems justify a repair and serve well afterward — but it changes the questions: how old is the unit, where is the leak, what else is worn, and what would the same money mean applied to a current-generation replacement? Households that ask those four questions with the numbers in front of them make the decision once; households that skip them often make it repeatedly, one hot season at a time.
Judge a refrigerant-era system by its leak history and its trend, not by a single charge reading. One low reading after many tight years is an event; a pattern of small losses is a biography, and the biography is what the economics should be based on. Prescott's climate record loads the question at both ends — a leaking system underperforms exactly when PRESCOTT LOVE FLD, AZ US's 50.4 hot days demand its full capacity, and its owner pays for refrigerant and lost performance simultaneously. The households that navigate this transition well keep one habit: they can state their system's age, refrigerant and last three repairs without looking them up. That small command of the facts converts an industry-wide generational change into a single household's managed decision, which is the scale at which it was always going to be decided anyway.
Count the generations the way a technician's route does: a single Prescott street can hold an R-22 veteran, two R-410A systems and a current-generation installation within a few doors. The service records of one metro contain the whole transition — which is why identification, not assumption, opens every diagnosis here.
One thermostat, one system, and a house that cannot agree on the temperature: the upstairs bakes while the downstairs needs a sweater, the addition never matches the original rooms, the far bedrooms run their own climate entirely. In Prescott this is among the most common comfort complaints in larger and multi-storey homes, and among the most misdiagnosed, because the equipment is usually innocent. A single system delivers air according to its duct network's design and its thermostat's location — and the thermostat only reports its own room. Floors gain heat differently, sun loads rooms differently by the hour, and duct runs deliver unevenly by length and condition, so the house's rooms drift apart while the system reports success at the one point it measures. The answers live at three levels: airflow correction in the existing network, zoning that lets one system serve areas on separate calls, and ductless equipment that gives the problem rooms their own dedicated capacity. Which level fits depends on how far apart the rooms are, and why — a diagnosis question before it is an equipment question.
Judge a multi-room home at its extremes, not at its thermostat. The thermostat sits, by convention, in the home's most average room, and it will report contentment while the nursery roasts and the end office freezes. The extremes are the system's true report card, and in Prescott they follow the climate record honestly: 50.4 hot days audit the upstairs, 113.0 freezing nights audit the far rooms over unheated spaces, and the household learns its home's real climate map from the rooms it avoids in each season. Homes whose extremes are comfortable have been sorted — by design, by correction or by dedicated equipment — and homes whose extremes are endured are carrying an unsorted map. The sorting is a solvable problem in essentially every case; what it cannot survive is being mistaken for an equipment failure and treated with a bigger version of the same single answer.
The climate record sets the pattern's stakes in Prescott: 1,068 cooling degree days load the upper floors through the summer while 4,056 heating degree days expose the far rooms all winter. A house with an unsorted delivery map is audited at both ends of the year — the pattern is not seasonal, it is structural, and the seasons merely take turns proving it.
A heating failure in mild weather is an appointment. The same failure in a hard freeze is a countdown, because a house without heat in Prescott's coldest weather is losing temperature toward the point where its plumbing becomes the next casualty. The record at PRESCOTT LOVE FLD, AZ US — 113.0 nights a year at or below freezing and 4,056 heating degree days across the season — says the exposure is not hypothetical here. As indoor temperature falls, the spaces that go first are the ones the heat reached last: pipes in exterior walls, runs through crawl spaces and garages, the plumbing of additions and rooms over unheated ground. A burst pipe discovered at the thaw converts one breakdown into two trades' worth of damage, which is why freeze-season heating calls run on different logic from every other call of the year: restore heat or protect the house, in that order, with no step treated as routine. Knowing the sequence before the night it is needed — how to keep a house safer while help travels, when to drip taps, when to shut water down — is part of owning a heated home in this climate.
The physics of the risk run on a simple clock. A house loses heat through its envelope at a rate set by the temperature difference across it; in a hard freeze that difference is the widest of the year, so the indoor temperature of an unheated house falls fastest exactly when the consequences of falling are gravest. The fall is uneven: rooms over unheated spaces and against the wind cool first, wall cavities housing pipes cool faster than the rooms they serve, and a pipe can reach freezing beside a room that still feels merely chilly. That unevenness is the trap in a household's intuition — the thermostat's reading is the house's average story, while the pipes live in its coldest footnotes. In Prescott the margin between a cold night and a damaging one is often a single night's depth of freeze against a house whose heat failed that morning, which is why the response sequence treats hours as the unit of value.
The climate record is the whole brief: 113.0 nights a year at or below freezing and 4,056 heating degree days at PRESCOTT LOVE FLD, AZ US. In Prescott, a heating failure is never only a heating failure in those weeks — it is a timed exposure for every pipe the heat was guarding, and the record brings the test back annually.
The desert pattern asks something unusual of a heating and cooling system: range. In Prescott, the record at PRESCOTT LOVE FLD, AZ US pairs genuinely hot days with nights that can fall far enough to call for heat, and the season between seasons can ask for cooling at noon and heating by the next morning within the same week. Equipment lives that range as thermal work — components expanding and contracting through wide daily swings — and controls live it as a scheduling puzzle the household has to solve deliberately: thermostat programs that anticipate the swing rather than chase it, changeover habits that do not fight yesterday's weather, and filters and coils maintained for a system that rarely gets a true off-season. The checks that matter here are the versatile ones: the heat proven before the first cold night that follows a hot month, the cooling run-tested before the first hot spell that interrupts spring, and the condensate and ductwork watched where attic temperatures swing hardest. Households that run this climate well stop thinking in single seasons and start thinking in readiness — the system able to answer either call, because the sky here makes both, sometimes in the same day.
The season loads Prescott's systems the way its record at PRESCOTT LOVE FLD, AZ US says it will: 4,056 heating degree days against 1,068 cooling degree days in an average year, against a housing stock whose median build year is 1994. The households that read the season early — filters, drains, a system run before the extreme weeks — are the ones whose calls stay schedulable.
In Prescott the transition's map is the housing map, lagged by one equipment generation. The districts built around Prescott Valley and the the 1990s streets hold the metro's R-22 veterans, in homes that have already seen one full cycle of this story when the equipment before them was young. The middle suburbs hold the R-410A majority. The 45,024 homes built since 2000 carry early current-generation systems now reaching the age where their first major repairs will be quoted — into a market whose standard has already moved on again. Read as a whole, the metro's 124,032 housing units contain the refrigerant industry's last several decades standing in rows, and the service economy of the metro is, in part, the business of keeping all those decades running at once. The deep pattern for a homeowner is simple to state and slow to change: your system's generation is a property of your street's building era, and its implications were installed with the house.
Strip the pattern down to its inputs and the ranking stops being mysterious: 108,900 households depending on systems installed across a median build year of 1994, in a climate that swings between 50.4 days of serious heat and 113.0 freezing nights. Whatever pattern a metro with those inputs manufactures most, it manufactures here — the lead position is less a title than a consequence, recalculated from the same public records any sceptic can check.
The first visit follows a short, diagnostic list — each item ruling a branch of the problem in or out:
Ordered by what this metro's data says its homes need most.
Every repair through TempReach USA follows the same order: diagnosis at the equipment, findings explained, quote given before work begins, and a full test cycle before the technician leaves your Prescott home.
One more pattern belongs in the Prescott picture: repair calls here are also a refrigerant story. Systems fitted in the older decades run on refrigerant generations the industry has been retiring, and every repair on those units weighs the charge's scarcity against the system's remaining life. The technician who explains that arithmetic plainly — what the repair restores, what it cannot assure anyone about next summer — is giving the household the real choice, and in the 29,148 pre-1980 homes it is a conversation held weekly. The PRESCOTT LOVE FLD, AZ US record — 4,056 heating degree days, 1,068 cooling — is the backdrop Yavapai County technicians plan around.
The local caseload behind this service is written in the climate figures: 1,068 cooling degree days a year and 50.4 days at 90 or above, pressing on a cooling fleet whose oldest members serve the 29,148 pre-1980 homes — in Prescott (46,744 residents) as much as in the oldest districts.
Through TempReach USA, a Prescott ductless installation is quoted as a complete design before work begins: units, positions, line routes, drainage and electrics, each room's reasoning shown.
Ductless work in Prescott also follows the housing nobody else can easily serve: the historic core around Prescott Valley, where walls were never built for ducts, and the accessory dwellings and in-law spaces appearing across Yavapai. Each installation is a small design project — line-set routes, condensate paths, the outdoor unit's placement — fitted to a building that predates the very idea of central air. Done well, the result is the quietest heating and cooling in the house. The 12.85 inches of rain in an average year here is part of the story too — humidity loads every cooling coil in the metro.
Scale the question by the Census count and it stays concrete: 124,032 housing units, a share of them holding rooms — additions, conversions, finished spaces — that no duct serves. The mini-split visit exists to give one of those rooms its own climate, sized to its exposure and use.
Stabilization precedes diagnosis. The fault isolated, the water contained, the dangerous component out of service — a repair decided in a worsening house is rarely the right one, so the worsening stops first.
Preparation is the quiet half of emergency work in Prescott, and it is written in the metro's figures: a housing stock of 124,032 units, median vintage 1994, spread over 28 ZIP codes, will produce its no-heat and no-cooling nights on a schedule the climate roughly predicts. The households that come through those nights with the least damage are rarely the lucky ones; they are the ones who know where the system's shutoffs and breakers are, keep the number where it can be found, and treat the system's small warnings — the odd noise, the short cycle, the room that drifts — as the appointments they were. With a median build year of 1994, most of the metro's 124,032 housing units are working through the same ageing curve.
Scale the problem by the Census count: 108,900 households depending on systems that cannot be improvised around — no heat in a freeze, no cooling in a heat wave. The emergency visit exists for the hours when waiting until Monday is not a plan, in Camp Verde this month, somewhere else next.
From Prescott Valley to Verde Village, a no-heat call through TempReach USA reaches a local professional whose visit includes the exchanger and venting checks that furnace work owes a Prescott household.
Across Yavapai, the cleaning question is answered the same way — look inside first. From Prescott Valley out through the 28 ZIP codes covered, matted buildup and renovation debris make the case; a light film makes the case for waiting.
With a median build year of 1994, many Prescott systems are reaching replacement age together; the professional you are connected with inspects ducts and electrics across 28 ZIP codes before recommending equipment.
From Prescott Valley to Verde Village, Prescott installations routed through TempReach USA finish with commissioning — combustion, temperature rise and airflow verified — so the fitted system is the specified system.
Heat pump services in Prescott test the whole year-round system: the independent local professional covering Yavapai reads charge and airflow in both modes, proves defrost, and checks auxiliary heat logic before quoting any work.
Across Yavapai, the housing split decides the starting point: older, leakier homes around Prescott Valley usually need filtration and moisture work first, while tighter newer builds in the 28 covered ZIP codes usually need deliberate ventilation most.
From Prescott Valley to the metro's edge, Prescott's 124,032 homes run every system type there is — single-stage furnaces, two-stage equipment, heat pumps with auxiliary heat — and each gets a control matched to its terminals, not a shelf guess.
In Prescott, the maintenance calendar writes itself from the climate: 4,056 heating degree days and 1,068 cooling degree days mean both systems work a real season, so the fall and spring visits each have genuine work to inspect.
Prescott's commercial buildings span every era around a median build year of 1994 — and with the era goes the equipment, from aging single units over old storefronts to multi-zone systems in new developments, all serviced from a per-unit record.
Ask where this metro's HVAC diary fills up and the answer is a short story: The refrigerant transition reaching older systems first, uneven temperatures and airflow across the house close behind, and the services that answer them doing the bulk of the booked work. Everything else on the list above is the supporting cast — necessary, frequent enough, but not what Prescott's housing stock, at its age and in its climate, principally demands. Read the service list as a weather report for the metro's systems and it stops looking like a catalogue.
PROBLEM SOLUTION
Population 48,048
Population 46,744
Population 13,372
Population 12,662
Population 12,547
Population 12,282
Population 9,770
Population 6,340
Population 6,112
Population 4,874
Population 4,642
Population 4,615
Also in the Prescott metro: Dewey-Humboldt (population 4,428), Cornville (population 3,356).
Read the grid as a building programme spread over a century. The oldest communities sit where the metro began; the youngest are still adding streets at its edge; and Prescott and Chino Valley, with 46,744 and 13,372 residents, stand for the rings in between. Each ring was fitted in its era's equipment, and each is now failing, wearing or holding in its era's characteristic order. The ZIP codes below draw the coverage boundary; the eras inside it draw everything else on this page — the problems ranked, the services ordered, the checks advised.
Also on the Prescott map: Verde Village (12,662), Cottonwood (12,547), Camp Verde (12,282), Sedona (9,770), Village of Oak Creek (Big Park) (6,340) — communities spread across Yavapai, each with housing from its own growth years. A technician routed through TempReach USA to any of them is working from this same page: the metro data does not change at the city limit, but the housing on your street — its age, its equipment, its attic — is what the visit is really about.
The metro's weight is not evenly spread. Prescott Valley holds 48,048 of the 241,656 residents; Prescott and Chino Valley add 46,744 and 13,372; and the remainder scatters across the smaller places above, some no bigger than a few thousand people. HVAC follows the weight — most calls come from where most homes are — but era matters more than size: a small community of 1960s housing generates older-system work than a large new subdivision does.
One metro, 1 county lines drawn through it: Yavapai. The lines are invisible to the weather, but they structure everything administrative around an HVAC job — which office permits it, which inspector signs it, which code edition applies. Yavapai County, at the centre, carries the oldest housing and the heaviest share of the work this page describes; its neighbours carry the growth. A routed local technician navigates the patchwork so the homeowner does not have to.
Three neighbouring coverage areas begin where this one ends: Flagstaff, AZ, some 94 miles off; Lake Havasu City, AZ, 100 miles; and Phoenix, AZ, 110 miles. Each keeps its own page because each keeps its own numbers — a different median build year, a different climate station, a different problem ranking. Boundary households should trust the ZIP list over the map: the code, not the compass, assigns the dataset.
The region around Prescott is a set of variations on its theme: Flagstaff, AZ, 94 miles off, runs a median build year of 1990 on a metro population of 144,368; Lake Havasu City, AZ (100 miles) medians 1994 on 228,102; Phoenix, AZ (110 miles) medians 1993 on 5,228,938. Nearness is not sameness — a few decades of median build year separate their heating and cooling as surely as the miles separate their maps.
Count the metro per unit of itself: 4,430 housing units per covered ZIP code; 108,900 households per county; 14 communities sharing 1 county governments. Then weigh the generations against each other — 0.6 older homes for each newer one — and the service pattern on this page stops being a list and becomes a proportion: that much of the diary written by ageing systems, the rest by young ones wearing in.
One line of Prescott arithmetic — a median home 32 years old · 80,042 owner-occupied homes against 28,858 renter-occupied · 248 pre-1960 homes for every covered ZIP code · a heating-to-cooling degree-day ratio of 3.8 · 326 mm of rain in an average year.
County pages carry the local detail — land area, climate normals and the heating and cooling pressures on the ground in each county.
More plain-language help: the TempReach USA heating & cooling guides
Describe the problem and the call center routes you to an independent local HVAC technician who works in the Prescott metro.
Call center hours: Mon-Fri 7:00 AM-10:00 PM ET | Sat 8:00 AM-10:00 PM ET | Sun 7:00 AM-9:00 PM ET