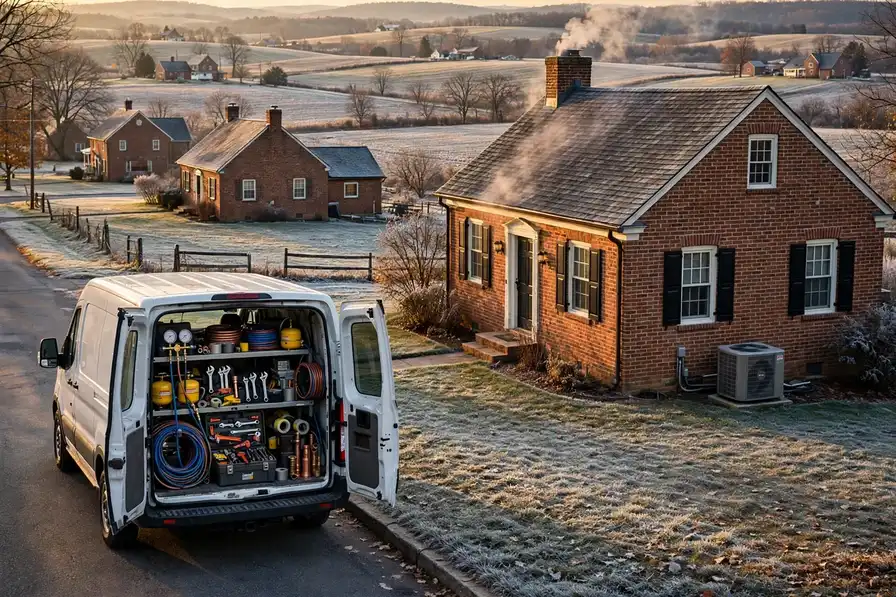


This is Lancaster's heating and cooling page, built from Lancaster's own numbers: Census housing figures, the metro's ZIP codes and its NOAA climate record. TempReach USA routes your call to an independent local HVAC technician; the homework below is here so you know your home's likely problems before you ever make it.
Call center hours: Mon-Fri 7:00 AM-10:00 PM ET | Sat 8:00 AM-10:00 PM ET | Sun 7:00 AM-9:00 PM ET
The median Lancaster home was built in 1977; 53.0% of the stock predates 1980, and the pattern this metro's own data ranks first is the refrigerant transition reaching older systems. TempReach USA is a referral service, not an HVAC company: one call connects you with an independent local HVAC technician serving your ZIP code.
Lancaster is a metro of 555,151 people and 210,536 households, and its heating and cooling is a portrait of its building history. The median home here was built in 1977; 53.0% of homes predate 1980 and 33.0% predate 1960, while 20.1% have arrived since 2000. Every one of those eras heated and cooled differently — different furnaces, different duct designs, different refrigerant generations — and they fail differently, which is why this page is organised around the patterns the data actually produces in Lancaster rather than HVAC in the abstract.
There is an equipment timeline buried in Lancaster's housing figures, and it reads like a technician's diary. The 71,895 homes from before 1960 were heated first and cooled later, their ducts added around floor plans that never imagined them. The 43,573 that followed between 1960 and 1979 mixed those retrofits with the first planned central systems. Then came the 58,823 homes of 1980-1999, fitted with matched systems as standard. Each band of that timeline is now a band of characteristic failures, arriving in the order the equipment tires — which is why a home's build year, in this metro, is the single most predictive fact about its heating and cooling.
The growth side of the metro tells the opposite story in the same language. Ephrata, Elizabethtown and the subdivisions still filling in account for much of the 43,790 homes built since 2000 — matched systems, planned ductwork, heat pumps where the lots suit them. Their HVAC is not old; it is uniform, which creates its own calendar: everything installed in the same boom reaches each wear point in the same years, from the first condenser replacements to the first control-board failures, while 984 cooling degree days of annual heat keep demand on the system high.
One more record sits over the whole metro, and it is the one the equipment itself keeps: the weather's. LANCASTER AP, PA US logs 42.06 inches of precipitation in an average year and swings between 17.8 days at 90 degrees or more and 109.2 nights at or below freezing. Heating systems ride that swing in their run hours; cooling systems ride it in their cycle counts; ducts ride it in the attics, expanding and contracting between the seasons. Cross the swing with the housing ages above and the selection of problems further down this page stops looking like a list and starts looking like an arithmetic result.
The metro's building eras on one side, its weather record on the other — and its heating and cooling where the two meet.
Break the stock down by building era and the profile sharpens. Before 1960: 33.0% of homes, roughly 71,895 of them. From 1960 to 1979: 20.0%, about 43,573. From 1980 to 1999: 27.0%, about 58,823. Since 2000: 20.1%, about 43,790. Four eras, four equipment generations — and the balance among them is this metro's HVAC character in a single paragraph.
This is, by the numbers, an old-system metro. The largest slice of its housing predates 1960, which means the typical serious job here involves equipment generations in their final chapters: ducts that leak by modern standards, furnaces renewed into them more than once, cooling added decades after the houses were built for heat alone. The newer bands exist — the growth since 2000 is real — but they are the supporting cast. Lancaster's HVAC identity was fixed by its earliest builders, and its problem list is written in their floor plans.
Second in the table, the 1980-1999 band: 58,823 homes, 27.0% of the metro. Its systems are mature rather than ancient — ducts still sound, first-generation efficiency equipment wearing toward its verdicts, controls reaching their wear points in waves — and its HVAC is the schedulable kind: work that rewards being booked before it becomes urgent.
Lancaster's weather, reduced to what a system experiences: 17.8 hot days a year loading the cooling, 109.2 freezing nights loading the heating, and 42.06 inches of rain feeding the humidity both seasons complain about. NOAA's normals at LANCASTER AP, PA US — 5,215 heating degree days, 984 cooling degree days — are the long average of that experience, and they are why this metro's problem list is not interchangeable with a milder or harsher metro's.
Hold the two halves together and the rest of this page explains itself: the problems ranked highest here are the ones where Lancaster's dominant housing era and its climate record overlap. Change either dataset and the ranking changes — which is precisely why this profile is rebuilt from the records for every metro instead of carried over from the last one.
Ordered by what this metro's data says its homes need most.
The local professional you are connected with reads the system the way it fails: electrical values first, then temperatures and pressures, then airflow, until one finding explains all of the symptoms at once.
Air conditioning in Lancaster works against the local calendar: 984 cooling degree days a year at LANCASTER AP, PA US, with 17.8 days at 90 degrees or more. The failures follow that load — capacitors and contactors worn by relentless summer cycling, refrigerant charges drifting low on systems that have served a decade of heat, condensate drains clogging in the humid weeks. The older districts run the oldest condensers; the subdivisions around Lancaster run matched fleets installed in the same seasons, and both sides of the metro meet the repair call on the hottest week of the year. That is the daily reality for the 210,536 households spread across Lancaster.
Count the exposure from the Census side: a median build year of 1977 across 217,863 housing units means half the metro's air conditioners are older than the systems in the growth suburbs around Ephrata, and summer runtime is the statistic that matters — the repair calls follow it street by street.
Verification is part of the service: a camera view, an opened panel, a register you can inspect yourself. The point of the visit is a duct system you have seen clean, not one you have been told is clean.
Duct cleaning in Lancaster is booked in waves that follow the housing: after the renovation seasons in the older districts, at move-in across the subdivisions, alongside system replacements everywhere. The work pairs naturally with the inspection that surrounds it — leaking joints found and sealed, a disconnected run in an attic discovered, insulation fallen where it should not be. The cleaning is the appointment; the findings are often the value. Count it in homes if you prefer: 115,467 built before 1980, 43,790 since 2000, one shared system of streets and seasons.
Duct demand concentrates in the metro's long-biography homes: 115,467 pre-1980 systems that have carried decades of household air, and the renovated homes around Columbia (10,217 residents) whose construction dust is still in the runs.
Honest limits, stated plainly: a tune-up does not make an old system new and cannot prevent every failure. It converts surprises into plans — which, across a system's life, is most of what reliability is made of.
The tune-up diary in Lancaster follows the installed base: the pre-1980 districts' ageing systems, kept in service by attention; the middle ring's equipment in its second decade, where maintenance decides whether it sees a third; the subdivisions' matched fleets, all reaching the same service points in the same seasons. A maintenance visit is measurement more than ritual — temperatures, pressures, electrical readings, airflow — recorded against last year's figures, so the system's direction is known rather than guessed. With a median build year of 1977, most of the metro's 217,863 housing units are working through the same ageing curve.
Tune-up demand follows the fleet's waves: the subdivisions' matched systems reaching service points together, the pre-1980 districts' individual units on individual schedules. Lititz sits inside one of those patterns; the readings taken there this season predict its systems' next one.
The lights-then-dies pattern in a Lancaster home is most often a flame sensor whose signal has weakened with oxidisation; measured in minutes by a professional, misdiagnosed for weeks by guesswork.
A furnace in Lancaster rarely fails all at once; it files warnings first. Short cycling on cold mornings, a rumble at startup, one room that never reaches the thermostat's number while the rest of the house overshoots. The metro's climate makes those warnings worth reading early — a system that limps in October is being examined by 109.2 freezing nights all winter. The repair visit tests the safety chain before anything else: the exchanger's integrity, the venting, the carbon monoxide picture, then the parts that wear. From Ephrata to Elizabethtown, the pattern repeats wherever the housing era matches.
Heating demand in Lancaster concentrates where the cold does its work: 109.2 nights a year at or below freezing, against a housing stock whose median build year is 1977. Around Mount Joy as in the old core, that combination is not an abstraction — it is the street's furnaces, house by house.
One call from anywhere in Lancaster's 53 covered ZIP codes reaches the routing: the failure's details taken, safety advice given on the spot, and the visit sequenced the same way everywhere — safety, stabilization, diagnosis, then repair or an honest scope.
Replacement in Lancaster begins with a load calculation across Lancaster: the independent local professional measures the home — not the old unit's label — and quotes the full scope before work begins.
From Lancaster to Columbia, Lancaster installations routed through TempReach USA finish with commissioning — combustion, temperature rise and airflow verified — so the fitted system is the specified system.
From Lancaster to Columbia, Lancaster heat pump calls through TempReach USA reach a local professional who explains findings plainly and quotes after assessing — in the heating season and the cooling season alike.
From period homes near Lancaster to newer builds toward Columbia, Lancaster's ductless projects serve the rooms central systems miss — additions, conversions and homes built without ductwork.
With a median build year of 1977 across 217,863 homes, Lancaster holds both air problems at once — envelopes that leak air freely and envelopes sealed tight — and the local professional assesses which house yours is before recommending equipment.
In Lancaster, the thermostat question splits by housing era: homes from around the median build year of 1977 often lack a common wire in the wall, while newer builds across the 53 covered ZIP codes usually carry one — the local professional checks the cable before choosing the control.
Across Lancaster, one climate ledger drives the calendar: 5,215 heating degree days and 984 cooling degree days mean roof units work both seasons hard, so the spring and fall visits each carry a full checklist here.
Two patterns generate most of the bookings behind the services above: The refrigerant transition reaching older systems and leaky ducts losing air and energy. That is why the order of this page's service list is what it is — the services answering those patterns come early, and the rest follow in the order the metro's data supports. A homeowner whose home matches the local profile — built in the metro's big decades, in one of its older districts — is, statistically, reading their own shortlist.
Selected and ranked from this metro's housing-age profile and climate record — not copied from another city's page.
A generation change is moving through Lancaster's cooling equipment, and it arrives one repair decision at a time. For decades, residential systems ran on R-22; production and import of that refrigerant ended in the United States in 2020, so the supply that remains is reclaimed stock, and servicing a leaking R-22 system means weighing a scarce, aging refrigerant against the age of the machine it serves. Newer systems moved to R-410A, and equipment now arriving uses lower-impact refrigerants such as R-454B, with their own handling and code requirements. The transition matters to a homeowner at specific moments: when an older system needs a charge, when a coil or compressor fails on a machine whose refrigerant is effectively retired, when a repair quote must be compared honestly against replacement. Nothing about it is a reason for panic — R-22 systems are not banned from being serviced — but every significant repair on one is now also a planning conversation, and households in Lancaster with equipment from the R-22 era benefit from having it before the hottest week, not during it.
Judge a refrigerant-era system by its leak history and its trend, not by a single charge reading. One low reading after many tight years is an event; a pattern of small losses is a biography, and the biography is what the economics should be based on. Lancaster's climate record loads the question at both ends — a leaking system underperforms exactly when LANCASTER AP, PA US's 17.8 hot days demand its full capacity, and its owner pays for refrigerant and lost performance simultaneously. The households that navigate this transition well keep one habit: they can state their system's age, refrigerant and last three repairs without looking them up. That small command of the facts converts an industry-wide generational change into a single household's managed decision, which is the scale at which it was always going to be decided anyway.
The regulatory facts are the foundation: R-22 production and import ended in the United States in 2020, leaving reclaimed stock as the supply, while new equipment has moved through R-410A to the current lower-impact generation. In Lancaster every generation still stands in service — the transition is not coming to this metro; it is distributed across it, yard by yard.
Returns deserve as much suspicion as supplies. A leaking supply loses conditioned air; a leaking return recruits unconditioned air — hot attic air in summer, cold crawl-space air in winter, and with it the dust and moisture of whichever space it crossed. In Lancaster's older housing, returns are often the rougher half of the network: panned joist spaces, wall cavities pressed into service, connections made to a standard the era allowed. The symptoms point back confusingly — a system that seems to stir dust, rooms that smell of the attic in summer, humidity the air conditioner cannot quite pull down. A duct assessment that only walks the supply side reads half the network. The returns are where the house breathes in, and a home whose returns breathe from its attic will never quite feel the way the equipment's specifications intend.
Households judge their heating and cooling at the thermostat, but the thermostat only reports the room it sits in. Judge the system at its furthest register instead: the air arriving there, its temperature against the supply at the unit, its volume against the room's need. In Lancaster that furthest room is the honest auditor of the duct network — it inherits every leak, every sag and every degree of attic heat between it and the air handler. The homes whose far rooms match their near rooms have networks that were sealed when they were built and checked as they aged. The homes whose far rooms lag are not necessarily homes with weak equipment; they are homes whose delivery network has been quietly resigning, joint by joint, while the equipment took the blame and the service calls. The register, not the nameplate, is where the resignation is announced.
The load figures complete the case: 984 cooling degree days and 5,215 heating degree days at LANCASTER AP, PA US mean the network is in service in earnest at both ends of the year. Duct loss here is not a summer inefficiency or a winter one; it is a twelve-month tax on a system that works both seasons.
An ageing system rarely announces its age in one event. It negotiates. In Lancaster the negotiation sounds like a house that takes longer to cool on the same afternoon weather, a furnace that needs two cycles to do what one did, a blower audible through a vent that used to be silent. The equipment in the metro's the 1970s homes has usually been repaired in pieces across the years — a motor here, a board there — so its age is not a single number but a profile of generations bolted together. That profile is what a thorough maintenance visit actually reads: which components are original, which are renewed, and where the next failure is most likely to file from. Households that know their system's profile make calm decisions; households that meet it for the first time in a breakdown make hurried ones.
The mechanics of ageing are unglamorous and cumulative. Bearings wear and draw more current. Capacitor values drift downward year by year, weakening every start they assist. Coil surfaces oxidize and foul, shedding their ability to exchange heat a fraction at a time. Refrigerant leaves through seals and joints at a pace too small to notice in a season and large enough to matter in five. Electrical connections loosen under thermal cycling and add resistance that becomes heat. None of these processes stops, but most of them are measurable long before they are fatal — which is precisely what separates maintenance from repair. A tune-up measures the drift; a repair replaces whatever the drift finally claimed. The household that buys measurement regularly buys the choice of when to spend on renewal, and that choice is worth the most on the oldest equipment.
Look at the replacement echoes: the 43,790 homes built since 2000 are now carrying first-generation equipment deep into its service life, joining the older cohorts. In Lancaster, ageing is not a niche condition of old houses; it is the metro's standard equipment profile.
A furnace earns its keep in the weeks a Lancaster winter stops being polite. The record at LANCASTER AP, PA US counts 109.2 nights a year at or below freezing and 5,215 heating degree days across the season, and in the coldest stretches a furnace that idled through autumn runs nearly without pause. That duty wears the parts that move and the parts that ignite: inducer and blower motors accumulate hours, igniters cycle thousands of times, flame sensors foul a little with every firing, and heat exchangers expand and contract through temperature swings that test their metal daily. The failures that follow have a rhythm homeowners recognize — a furnace that lights and quits, one that runs but heats unevenly, one that was fine in November and silent in the coldest week of January. Cold does not usually break a sound furnace; it collects the wear the furnace had been carrying quietly, and it collects at the moment the household can least spare the heat.
A technician reading a tired furnace works from the safety chain outward. Modern furnaces report themselves through lockouts and fault codes, and the pattern of the lockout is the first text: ignition failures point one way, overheating shutdowns another, pressure-switch faults toward venting and condensate. In cold weather the venting branch matters more than households expect — snow, ice and wind can obstruct terminations, and a furnace that will not prove its draft will not fire, by design. The heat exchanger inspection belongs in the same visit whenever age or overheating symptoms suggest it, because a cracked exchanger is the one finding that changes the conversation from repair to replacement on safety grounds. What looks from the hallway like 'the furnace stopped' resolves, under a practiced sequence, into one worn branch of a short list.
The climate record is the prosecution's whole case: 5,215 heating degree days and 109.2 nights at or below freezing at LANCASTER AP, PA US in an average year. A furnace in Lancaster is not occasionally cold-weather equipment; it is a machine audited by winter, annually, at full load.
The shoulder season is the system's handover, and like any handover it exposes what the outgoing shift left undone. In Lancaster, the spring shoulder inherits winter's account — a filter loaded with the heating season, an igniter that has fired its thousands, heating symptoms nobody acted on once the weather softened — while the autumn shoulder inherits summer's: a coil washed by months of condensate, a drain carrying the season's growth, starting parts worn by the hot months' work. Clearing each inheritance before the next season draws on the account is the whole craft here, and it is light work precisely because the weather, for these few weeks, is not in a hurry.
The season loads Lancaster's systems the way its record at LANCASTER AP, PA US says it will: 5,215 heating degree days against 984 cooling degree days in an average year, against a housing stock whose median build year is 1977. The households that read the season early — filters, drains, a system run before the extreme weeks — are the ones whose calls stay schedulable.
In Lancaster the transition's map is the housing map, lagged by one equipment generation. The districts built around Lancaster and the the 1970s streets hold the metro's R-22 veterans, in homes that have already seen one full cycle of this story when the equipment before them was young. The middle suburbs hold the R-410A majority. The 43,790 homes built since 2000 carry early current-generation systems now reaching the age where their first major repairs will be quoted — into a market whose standard has already moved on again. Read as a whole, the metro's 217,863 housing units contain the refrigerant industry's last several decades standing in rows, and the service economy of the metro is, in part, the business of keeping all those decades running at once. The deep pattern for a homeowner is simple to state and slow to change: your system's generation is a property of your street's building era, and its implications were installed with the house.
The numbers underneath it, for Lancaster: 217,863 housing units, a median build year of 1977, and a climate record at LANCASTER AP, PA US of 5,215 heating degree days against 984 cooling degree days. Cross the housing record with the weather record and this pattern is what falls out at the top — rarely the most dramatic problem in heating and cooling, but the one this metro's stock and climate manufacture most steadily.
On a first visit for this pattern, a local technician's checks run in a practised order:
PROBLEM SOLUTION
Population 57,683
Population 13,729
Population 11,857
Population 10,217
Population 10,010
Population 9,599
Population 8,711
Population 8,310
Population 8,107
Population 5,743
Population 5,028
Population 4,575
Also in the Lancaster metro: Maytown (population 4,321), Akron (population 4,133).
Read the grid as a building programme spread over a century. The oldest communities sit where the metro began; the youngest are still adding streets at its edge; and Ephrata and Elizabethtown, with 13,729 and 11,857 residents, stand for the rings in between. Each ring was fitted in its era's equipment, and each is now failing, wearing or holding in its era's characteristic order. The ZIP codes below draw the coverage boundary; the eras inside it draw everything else on this page — the problems ranked, the services ordered, the checks advised.
Also on the Lancaster map: Columbia (10,217), Willow Street (10,010), Lititz (9,599), Millersville (8,711), Mount Joy (8,310) — communities spread across Lancaster, each with housing from its own growth years. A technician routed through TempReach USA to any of them is working from this same page: the metro data does not change at the city limit, but the housing on your street — its age, its equipment, its attic — is what the visit is really about.
Start with Lancaster itself: 57,683 residents, 10.4% of the metro — the centre the rest of the map orbits. Ephrata (13,729) and Elizabethtown (11,857) form the next ring out, housing with its own building decades and its own equipment generations. Beyond them the metro thins into the smaller communities in the grid above, each a few thousand households deep — small in population, identical in one respect: their systems answer to the same eras and the same weather as the big city's.
Draw the metro by its paperwork and it resolves into Lancaster — 1 jurisdictions sharing one housing stock and one weather system. Lancaster County holds the historic centre and the densest share of the older homes; the surrounding counties hold the rings of growth around it. Permits and inspections follow those boundaries even though temperature never does, which is part of why the technician this page connects you to works these streets specifically.
Beyond the metro line, the nearest covered metros are Lebanon, PA (25 miles away), York, PA (27 miles) and Reading, PA (31 miles) — separate pages, separate profiles, because their housing and weather records are their own. Homeowners near the boundary sit between two datasets; the ZIP list above, not the map's edge, decides which page was written about your stock.
Set Lancaster among its neighbours and the contrasts sharpen the profile: Lebanon, PA — metro population 146,380, median build year 1971 — sits 25 miles away; York, PA (473,197, median 1976) 27 miles; Reading, PA (440,072, median 1968) 31 miles. Three different housing stocks under three nearby skies, which is why each keeps its own page and its own problem ranking rather than borrowing this one.
Ratios tell the metro's story compactly. Renters occupy 30.1% of homes; owners hold the rest. For every home built since 2000 there are 2.6 from before 1980. Spread the stock across the coverage map and each ZIP code carries about 4,111 housing units — the density at which era patterns repeat street after street instead of scattering, and at which a routed round of calls stays inside a few districts.
Lancaster by the derived numbers — median home age 49 years · owners in 147,165 homes, renters in 63,371 · each covered ZIP code carrying about 1,357 pre-1960 homes · a heating-to-cooling degree-day ratio of 5.3 · 1,068 mm average annual rainfall.
County pages carry the local detail — land area, climate normals and the heating and cooling pressures on the ground in each county.
More plain-language help: the TempReach USA heating & cooling guides
Describe the problem and the call center routes you to an independent local HVAC technician who works in the Lancaster metro.
Call center hours: Mon-Fri 7:00 AM-10:00 PM ET | Sat 8:00 AM-10:00 PM ET | Sun 7:00 AM-9:00 PM ET