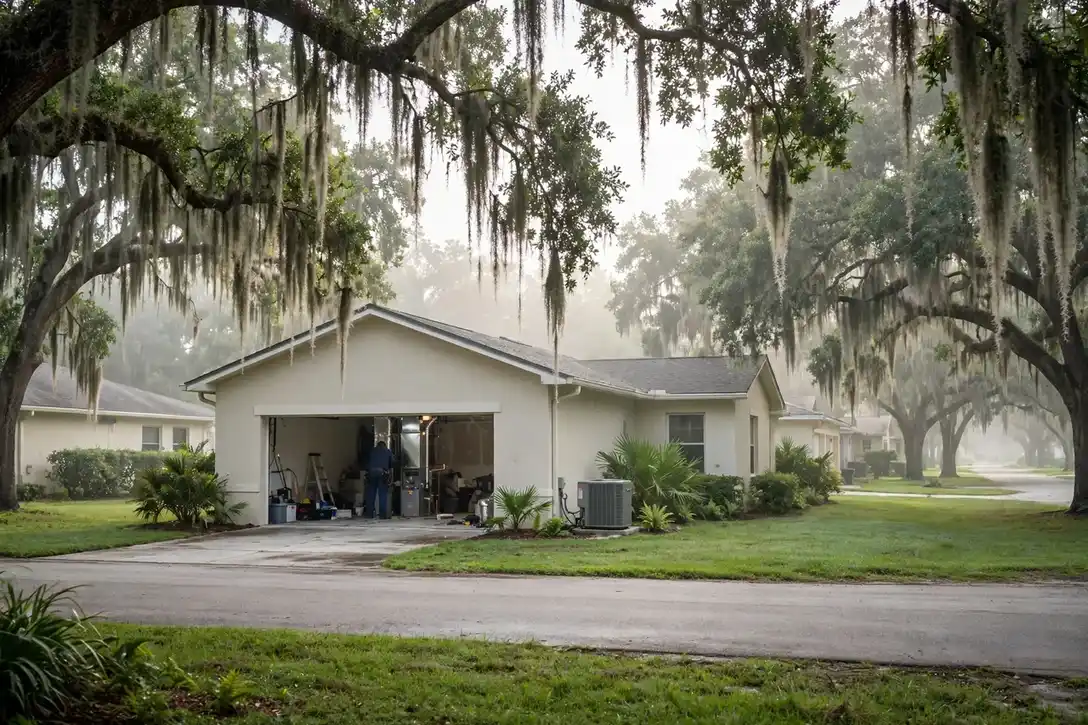


Everything on this page was computed for Jacksonville and nowhere else: the problem ranking from its Census housing profile, the seasonal risks from its NOAA station record, the coverage from its own ZIP codes. TempReach USA connects you to an independent local HVAC technician; the page itself is the homework, done in public, so the call you make is an informed one.
Call center hours: Mon-Fri 7:00 AM-10:00 PM ET | Sat 8:00 AM-10:00 PM ET | Sun 7:00 AM-9:00 PM ET
The median Jacksonville home was built in 1991; 32.7% of the stock predates 1980, and the pattern this metro's own data ranks first is humidity burden on homes and cooling systems. TempReach USA is a referral service, not an HVAC company: one call connects you with an independent local HVAC technician serving your ZIP code.
Start with the raw material: 1,645,707 people, 713,833 housing units, and a housing stock whose middle home was built in 1991. That single date organises everything on this page. On one side of it stand the older districts — 14.0% of homes predate 1960, 32.7% predate 1980 — heated and cooled by systems renewed in pieces for decades, in homes across Baker, Clay, Duval, Nassau, St. Johns. On the other side, the 36.8% built since 2000 run matched modern equipment, and fail in the newer ways. A Jacksonville technician reads a home's build year the way a doctor reads a chart: it predicts, before a single panel is opened, which systems deserve suspicion first.
There is an equipment timeline buried in Jacksonville's housing figures, and it reads like a technician's diary. The 99,937 homes from before 1960 were heated first and cooled later, their ducts added around floor plans that never imagined them. The 133,487 that followed between 1960 and 1979 mixed those retrofits with the first planned central systems. Then came the 217,719 homes of 1980-1999, fitted with matched systems as standard. Each band of that timeline is now a band of characteristic failures, arriving in the order the equipment tires — which is why a home's build year, in this metro, is the single most predictive fact about its heating and cooling.
The growth side of the metro tells the opposite story in the same language. Fruit Cove, Lakeside and the subdivisions still filling in account for much of the 262,691 homes built since 2000 — matched systems, planned ductwork, heat pumps where the lots suit them. Their HVAC is not old; it is uniform, which creates its own calendar: everything installed in the same boom reaches each wear point in the same years, from the first condenser replacements to the first control-board failures, while 3,303 cooling degree days of annual heat keep demand on the system high.
The weather's part in this is written at JACKSONVILLE NAS, FL US, where an average year carries 47.6 inches of precipitation, 96.4 days at ninety degrees or more and 3.7 nights at freezing or below. Systems experience that year as workload and as stakes in roughly equal measure — the workload in the run hours, the stakes on the single coldest night and the single hottest week. The problem ranking further down is simply the housing profile above, read under this sky.
The metro's building eras on one side, its weather record on the other — and its heating and cooling where the two meet.
The distribution, in one breath: of every hundred Jacksonville homes, 14.0 were standing before 1960, 18.7 went up in the two decades after, 30.5 in the two after that, and 36.8 have arrived since 2000. Percentages flatten the picture, so hold the counts beside them — 99,937 oldest-era homes, 262,691 newest — and the metro's heating and cooling stops being an abstraction: it is that many systems, of those ages, failing in that order.
Growth is the headline in Jacksonville: the post-2000 band is the largest, much of it subdivisions fitted with matched modern systems and ductwork designed as a single plan. The work here is young-stock work — first replacements arriving in waves as whole streets age together, heat pumps standard where their neighbours have furnaces, controls and sensors failing in preference to iron. The metro's older pockets still generate the deep problems, but the volume of its HVAC future is being written in the new subdivisions.
The runner-up era is 1980-1999, with 30.5% of homes. That stock has left its carefree decades and entered its maintenance decades, and it shows in the call pattern around Fruit Cove and the other districts of those years: condensers on their second cycle, furnaces reaching their wear points together, ducts still young enough to reward attention over replacement.
Start the climate half where the system starts: at the thermostat's two seasons. Jacksonville's cooling answers 3,303 cooling degree days of load and its heating answers 944 heating degree days of cold at JACKSONVILLE NAS, FL US — an average temperature of 71.4 degrees that no individual week actually delivers. A heating and cooling system here is never in neutral; the record keeps it working at one end or the other all year.
Hold the two halves together and the rest of this page explains itself: the problems ranked highest here are the ones where Jacksonville's dominant housing era and its climate record overlap. Change either dataset and the ranking changes — which is precisely why this profile is rebuilt from the records for every metro instead of carried over from the last one.
Listed in the order this metro's housing and climate data supports.
Three parts, one system: filtration captures what the air carries, humidity control keeps moisture where the building tolerates it, and ventilation replaces stale air on schedule. Equipment chosen for one part cannot do the others' work.
The air quality conversation in Jacksonville starts with humidity more often than with gadgets. A home whose summer indoor humidity rides high grows musty at the coil and uncomfortable at the thermostat, and a home dried out by 944 heating degree days of winter runtime irritates skin, wood and sinuses in the opposite direction. The assessment measures before it prescribes: humidity in both seasons, the filter's actual condition and fit, the duct leakage that pulls attic or crawl-space air into the supply stream in the metro's older districts. With a median build year of 1991, most of the metro's 713,833 housing units are working through the same ageing curve.
Air quality demand in this metro is written by its sealed seasons: 96.4 hot days with the windows shut around the cooling, 3.7 freezing nights with them shut around the heat. The 262,691 post-2000 homes hold their air tightest; the older districts around Fruit Cove exchange theirs with attics and crawl spaces.
Where this service gets booked in Jacksonville follows the map on this page: the older districts generate the deep-end work, the post-2000 subdivisions the wear-and-tear work, and the 217,719 homes in between split the difference. Telling the call center your home's build decade — most Jacksonville owners know it within a few years — puts the right kit on the van the first time.
Warm air from the vents is a symptom with several authors — capacitor, charge, airflow, controls — and AC repair in Jacksonville separates them by measurement at your unit, not by parts swapped on hope.
Cooling failure in Jacksonville is rarely random. It bunches on the first serious heat wave, again in the late-summer grind, and it concentrates where the equipment is oldest — the pre-1980 districts, 32.7% of the metro's housing — and where the newest subdivisions' identical units reach the same wear points in the same seasons. The technician who works these streets stocks the van for both patterns: the ageing system's slow decline and the young fleet's shared failures. That is the daily reality for the 642,847 households spread across Baker, Clay, Duval, Nassau, St. Johns.
Count the exposure from the Census side: a median build year of 1991 across 713,833 housing units means half the metro's air conditioners are older than the systems in the growth suburbs around Oakleaf Plantation, and summer runtime is the statistic that matters — the repair calls follow it street by street.
One local habit worth copying: Jacksonville homeowners who mention their street's building era when they book get a better-matched visit, because a technician heading to a the 1990s home in Baker County loads different parts than one heading to a new-build subdivision in Fruit Cove. The service is the same; the preparation is local.
In Jacksonville, the drip from an indoor unit is a drainage story — a clogged line, a failed pump, a route without fall — and it is corrected at the drain path, not wiped up and watched.
Mini-splits also answer a Jacksonville housing pattern the census tables only hint at: the multigenerational home, the converted space, the workshop that became an office. Across 642,847 households, the rooms that need conditioning keep multiplying faster than duct systems can follow, and a ductless head follows in an afternoon's installation where a duct extension would take a renovation. The assessment stays the same — the space, its exposure, its use — but the question it answers is as much about how the household lives as how the house was built. Ask in Oakleaf Plantation and the answer rhymes with Jacksonville: same eras, same equipment generations, same calendar of failures.
The search territory for ductless is the metro's unducted stock: 99,937 pre-1960 homes built before central systems, plus the additions and conversions scattered through 642,847 households — in Nocatee and the historic core alike, spaces the main system never reached.
In Jacksonville this service is booked most often through the problem patterns at the top of this page — the metro's housing data, not habit, sets the order. If your home is in the 32.7% built before 1980, mention its age on the call: it changes the parts the technician loads before heading to Jacksonville and the rest of the metro.
Verification is part of the service: a camera view, an opened panel, a register you can inspect yourself. The point of the visit is a duct system you have seen clean, not one you have been told is clean.
What comes out of a Jacksonville duct system tells the home's biography: drywall dust from the renovation, pet hair in proportion to the household, the fine grit that 47.6 inches of yearly rain and the dry seasons between them work into every return. Cleaning matters most where the biography is long — the pre-1980 homes, 32.7% of the stock — and where a household's breathing argues for it. A technician who shows the before and after, and says plainly when a system does not need the work, is the one whose advice holds up. The 47.6 inches of rain in an average year here is part of the story too — humidity loads every cooling coil in the metro.
Count the systems and the diary fills itself: 642,847 households breathing through ductwork daily, the oldest of it in homes from the 1990s and the newest in the subdivisions past Jacksonville Beach. What the cleaning finds follows the biography — dust in proportion to years, debris in proportion to renovations.
One local habit worth copying: Jacksonville homeowners who mention their street's building era when they book get a better-matched visit, because a technician heading to a the 1990s home in Baker County loads different parts than one heading to a new-build subdivision in Fruit Cove. The service is the same; the preparation is local.
With a median build year of 1991, many Jacksonville systems are reaching replacement age together; the professional you are connected with inspects ducts and electrics across 62 ZIP codes before recommending equipment.
Across 62 ZIP codes, Jacksonville heating stock reflects a median build year of 1991 — furnaces at every age, each diagnosed on its own sequence and condition rather than its birthday.
Heating installation in Jacksonville starts with a heat-loss calculation across Baker, Clay, Duval, Nassau, St. Johns: the independent local professional measures the home's loss, inspects ducts and venting, and quotes the full scope before work begins.
Heat pump services in Jacksonville test the whole year-round system: the independent local professional covering Baker, Clay, Duval, Nassau, St. Johns reads charge and airflow in both modes, proves defrost, and checks auxiliary heat logic before quoting any work.
In Jacksonville, the thermostat question splits by housing era: homes from around the median build year of 1991 often lack a common wire in the wall, while newer builds across the 62 covered ZIP codes usually carry one — the local professional checks the cable before choosing the control.
From the oldest housing in Jacksonville to the newest subdivisions in its 62 covered ZIP codes, the tune-up's question is identical and local at once: what do this system's measurements say, this season, before the weather asks it anything hard?
In Jacksonville, emergency means weather-relative: 944 heating degree days put no-heat calls on a freezing clock each winter, while 3,303 cooling degree days make a dead system a health question each summer — the call center triages against both, using the hours shown on this page.
Across Baker, Clay, Duval, Nassau, St. Johns, one climate ledger drives the calendar: 944 heating degree days and 3,303 cooling degree days mean roof units work both seasons hard, so the spring and fall visits each carry a full checklist here.
If this page's services were ranked by Jacksonville's call patterns rather than listed in catalogue order, they would come out much as they do here — because the ranking behind them is data, not habit. Humidity burden on homes and cooling systems leads the metro's problem table and the refrigerant transition reaching older systems follows, so the services answering them lead the list. The long tail of a metro's HVAC life — thermostat calls, duct questions, the one room that never matches the rest — fills in the diary around them, here as everywhere.
Ranked for this metro alone, from its Census housing profile and NOAA climate record.
The oversized system is humidity's favorite accomplice. In Jacksonville, cooling equipment has often been replaced like for like or rounded up in size over the years, and a unit with more capacity than the house needs satisfies the thermostat quickly — then stops, with the coil warming and its collected moisture still in the air stream's neighborhood. Temperature is a fast variable; moisture is a slow one. A house can hit its setting while barely denting its indoor humidity, and the gap between the two is where the clammy afternoons live. Correct sizing, correct airflow and longer, steadier cycles are the equipment side of the answer; the house side — ventilation of wet rooms, vapor sources managed, drainage and grade outside — decides how much burden arrives for the equipment to carry in the first place.
The physics of the burden are worth stating plainly. Air holds water as vapor; the amount it can hold rises with temperature, which is why warm air arriving in a Jacksonville summer carries so much of it indoors. A cooling coil removes moisture by passing air across a surface cold enough for water to condense on it — the same physics that beads a cold glass. Two conditions govern how much condenses: how long the air stays against the cold coil, and how cold the coil runs. Short cycles starve the first; high airflow can starve the second. Meanwhile the house keeps adding vapor from living and from its own damp places, and the envelope keeps trading air with the outdoors. Indoor humidity is the running balance of that account — removal by the coil against addition by everything else — and a house that feels damp is simply a house whose account is out of balance in the wet direction.
Count the load the way the coil experiences it: through the humid months, each pass of indoor air delivers moisture that must condense and drain before the air can feel finished. In Jacksonville, where cooling degree days reach 3,303 a year, that invisible water work rivals the temperature work the system was named for.
The transition is, at bottom, a story about what is inside the pipes. A cooling system is not a generic appliance; it is built around a specific refrigerant, with a compressor, metering device and oils chosen for that chemistry, and the generations do not interchange. In Jacksonville all the generations are in service simultaneously — R-22 veterans in the older districts, R-410A systems across the middle decades, the newest refrigerant generation arriving in current installations — and a technician's van effectively serves three eras of the same trade at once. The homeowner's part in the story is knowledge of a single fact: which generation is in the backyard. That fact, readable from the nameplate, decides the economics of every leak, every charge and every major component from now on, and it is the first thing a good service conversation establishes.
Judge a refrigerant-era system by its leak history and its trend, not by a single charge reading. One low reading after many tight years is an event; a pattern of small losses is a biography, and the biography is what the economics should be based on. Jacksonville's climate record loads the question at both ends — a leaking system underperforms exactly when JACKSONVILLE NAS, FL US's 96.4 hot days demand its full capacity, and its owner pays for refrigerant and lost performance simultaneously. The households that navigate this transition well keep one habit: they can state their system's age, refrigerant and last three repairs without looking them up. That small command of the facts converts an industry-wide generational change into a single household's managed decision, which is the scale at which it was always going to be decided anyway.
Housing arithmetic shows the exposure: with 32.7% of Jacksonville's homes built before 1980 and equipment replaced in long cycles ever since, a substantial share of the metro's systems belong to refrigerant generations the market has already succeeded. The nameplates say so, one address at a time.
Ask what extreme heat breaks first and the honest answer is: whatever was already closest to the edge. In Jacksonville that is usually an electrical part rather than the compressor itself — a capacitor swollen by heat and hard starts, a contactor whose points have pitted through seasons of cycling, a condenser fan motor running hot in still air. The pattern shows in the timing: failures at the hottest hour, systems that restart after cooling down, cooling that fades as the afternoon builds. Those are load symptoms, and they point a technician toward the outdoor unit and its electrical cabinet before anything indoors. Homes around Jacksonville and across the metro share the pattern because they share the weather; the age of the unit decides which home the heat collects from first.
The physics underneath is simple enough. An air conditioner does not create cold; it moves heat from indoors to outdoors, and it moves that heat against the temperature difference between the two. The hotter it is outside, the harder the compressor must work to push heat uphill, and the longer the system must run to hold the same indoor temperature. In Jacksonville the design assumptions behind older systems were written for a milder version of this contest. A unit installed when the surrounding streets were newer now serves a home with more heat gain — mature trees gone or grown, additions built, attic insulation settled — while its own capacity has thinned with age. The gap between what the house asks and what the unit can give widens a degree at a time, and extreme heat is when the gap becomes a number the thermostat reports every afternoon.
The evidence is in the calendar as much as the equipment. Heat failures in Jacksonville cluster in the season's hottest stretches — the same weeks JACKSONVILLE NAS, FL US records its highest readings — because the load, not luck, is what finishes weakened components.
Zoning is the structural answer built for exactly this geometry: dampers in the duct network, a thermostat for each zone, and a control that lets the single system answer different areas on different calls. The upstairs can hold its setting without freezing the downstairs; the addition can call without dragging the whole house with it. In Jacksonville's larger homes — the multi-storey plans that multiplied in the the 1990s decades and after — zoning converts one compromised average into several kept settings. It is not the right answer everywhere: it needs ductwork that can be sectioned sensibly and a system whose sizing and controls suit the arrangement, which is why the assessment starts with the network's map. But where the map allows, zoning answers the complaint at its actual address — the mismatch between one measurement point and a houseful of different needs.
Judge a multi-room home at its extremes, not at its thermostat. The thermostat sits, by convention, in the home's most average room, and it will report contentment while the nursery roasts and the end office freezes. The extremes are the system's true report card, and in Jacksonville they follow the climate record honestly: 96.4 hot days audit the upstairs, 3.7 freezing nights audit the far rooms over unheated spaces, and the household learns its home's real climate map from the rooms it avoids in each season. Homes whose extremes are comfortable have been sorted — by design, by correction or by dedicated equipment — and homes whose extremes are endured are carrying an unsorted map. The sorting is a solvable problem in essentially every case; what it cannot survive is being mistaken for an equipment failure and treated with a bigger version of the same single answer.
The solar arithmetic testifies daily: on the 96.4 days a year at 90 degrees or more recorded at JACKSONVILLE NAS, FL US, a roof-loaded second storey is a measurably hotter building than the floor below it, served by the same machine and judged by the same single thermostat. The divergence is not a malfunction; it is the design being outvoted by physics.
There is also a quieter loss running underneath the comfort loss: what leaks out was paid to condition. Every run of the system heats or cools a volume of air; the share that escapes into the attic or crawl space is work done for no room, repeated cycle after cycle, season after season. In a Jacksonville home the arithmetic is worst exactly when the load is highest — the 96.4 hot days push the longest runs through the hottest attics — so the loss curve and the demand curve rise together. Sealing is unglamorous work: mastic on joints, connections re-made and supported, insulation restored where it has fallen. But it is one of the few interventions whose benefit the household can feel at the register on the first run afterward, in air that arrives at the temperature and volume the system produced.
Households judge their heating and cooling at the thermostat, but the thermostat only reports the room it sits in. Judge the system at its furthest register instead: the air arriving there, its temperature against the supply at the unit, its volume against the room's need. In Jacksonville that furthest room is the honest auditor of the duct network — it inherits every leak, every sag and every degree of attic heat between it and the air handler. The homes whose far rooms match their near rooms have networks that were sealed when they were built and checked as they aged. The homes whose far rooms lag are not necessarily homes with weak equipment; they are homes whose delivery network has been quietly resigning, joint by joint, while the equipment took the blame and the service calls. The register, not the nameplate, is where the resignation is announced.
The load figures complete the case: 3,303 cooling degree days and 944 heating degree days at JACKSONVILLE NAS, FL US mean the network is in service in earnest at both ends of the year. Duct loss here is not a summer inefficiency or a winter one; it is a twelve-month tax on a system that works both seasons.
Heat is not an event in Jacksonville; it is a season, and a long one. The record at JACKSONVILLE NAS, FL US counts 96.4 days a year at 90 degrees or more and 3,303 cooling degree days, which means the metro's air conditioners work their longest shifts exactly when the air they must reject heat into is at its hottest. The households that come through the season smoothly treat it as a campaign with a beginning: before the first serious heat, the outdoor coil is washed clear of the spring's debris, the filter is fresh, the condensate drain is proven clear, and the system is run long enough on a warm day to show how it behaves under load — startup, sound, the temperature it delivers at the registers. During the season, the checks are small and regular: the outdoor unit kept clear of growth and stored items, the filter watched monthly because a loaded filter in peak season throttles a system already at full stretch, and indoor temperatures read honestly — a house drifting upward through a hot afternoon is the system filing an early report, and answering it in June is a different errand from answering it in the season's hottest week.
The season loads Jacksonville's systems the way its record at JACKSONVILLE NAS, FL US says it will: 944 heating degree days against 3,303 cooling degree days in an average year, against a housing stock whose median build year is 1991. The households that read the season early — filters, drains, a system run before the extreme weeks — are the ones whose calls stay schedulable.
The burden has an address pattern in Jacksonville, and it follows water's own map. The low ground and the older districts — the streets around Jacksonville and the housing that grew before modern drainage and vapor standards — carry the metro's dampest houses: crawl spaces close to grade, foundations that have managed a century of rain, ductwork running through the wettest air in the home. The 233,423 pre-1980 homes concentrate these conditions, and their cooling systems inherit a drying load that newer construction on higher, drier detailing simply does not present. Add the climate's own delivery — the wet season pressing in through every envelope leak — and the humidity map of the metro is drawn twice over, once by its terrain and once by its building history. Technicians who work the map know which neighborhoods' calls will mention the smell, the sweating registers and the sticky rooms before the homeowner finishes the sentence.
Read the ranking backwards and it reads as a data summary: 1,645,707 residents in 713,833 housing units, 14.0% of the housing from before 1960, 47.6 inches of rain in an average year. The pattern leads because the exposure is broad — counted not in individual unlucky houses but in whole eras of the metro's building, stacked one on another.
On a first visit for this pattern, a local technician's checks run in a practised order:
PROBLEM SOLUTION
Population 961,739
Population 35,609
Population 31,548
Population 30,737
Population 29,351
Population 25,581
Population 24,485
Population 23,601
Population 19,775
Population 15,521
Population 14,979
Population 13,887
Also in the Jacksonville metro: Asbury Lake (population 13,465), Atlantic Beach (population 13,353).
The communities in the grid are not suburbs of the page; they are its subject as much as Jacksonville is. Fruit Cove (35,609 residents) and Lakeside (31,548) carry their own building decades, their own equipment generations and their own positions in the problem ranking's logic — a system under a Fruit Cove roof answers to the same data as one in the centre, but to a different era of it. Coverage here is defined by the ZIP list below; understanding is defined street by street, and this page's figures are the metro-wide version of a story each community tells in its own numbers.
Beyond the largest communities sit Oakleaf Plantation (30,737), Fleming Island (29,351), Nocatee (25,581), World Golf Village (24,485), Jacksonville Beach (23,601) — smaller places across Baker, Clay, Duval, Nassau, St. Johns, covered on the same terms. Their housing tends to be older on average than the big suburbs', and their calls follow the older patterns on this page. One routing covers them all: find your ZIP code below and the rest is a phone call.
Start with Jacksonville itself: 961,739 residents, 58.4% of the metro — the centre the rest of the map orbits. Fruit Cove (35,609) and Lakeside (31,548) form the next ring out, housing with its own building decades and its own equipment generations. Beyond them the metro thins into the smaller communities in the grid above, each a few thousand households deep — small in population, identical in one respect: their systems answer to the same eras and the same weather as the big city's.
One metro, 5 county lines drawn through it: Baker, Clay, Duval, Nassau, St. Johns. The lines are invisible to the weather, but they structure everything administrative around an HVAC job — which office permits it, which inspector signs it, which code edition applies. Baker County, at the centre, carries the oldest housing and the heaviest share of the work this page describes; its neighbours carry the growth. A routed local technician navigates the patchwork so the homeowner does not have to.
Beyond the metro line, the nearest covered metros are Gainesville, FL (70 miles away), Ocala, FL (72 miles) and Daytona Beach, FL (75 miles) — separate pages, separate profiles, because their housing and weather records are their own. Homeowners near the boundary sit between two datasets; the ZIP list above, not the map's edge, decides which page was written about your stock.
Set Jacksonville among its neighbours and the contrasts sharpen the profile: Gainesville, FL — metro population 359,036, median build year 1988 — sits 70 miles away; Ocala, FL (442,660, median 1992) 72 miles; Daytona Beach, FL (746,933, median 1988) 75 miles. Three different housing stocks under three nearby skies, which is why each keeps its own page and its own problem ranking rather than borrowing this one.
Count the metro per unit of itself: 11,513 housing units per covered ZIP code; 128,569 households per county; 14 communities sharing 5 county governments. Then weigh the generations against each other — 0.9 older homes for each newer one — and the service pattern on this page stops being a list and becomes a proportion: that much of the diary written by ageing systems, the rest by young ones wearing in.
The Jacksonville record in one line — median home age: 35 years · owner-occupied homes: 426,208 · renter-occupied homes: 216,639 · pre-1960 homes per covered ZIP code: 1,612 · heating-to-cooling degree-day ratio: 0.29 · average rainfall: 1,209 mm a year.
County pages carry the local detail — land area, climate normals and the heating and cooling pressures on the ground in each county.
More plain-language help: the TempReach USA heating & cooling guides
Describe the problem and the call center routes you to an independent local HVAC technician who works in the Jacksonville metro.
Call center hours: Mon-Fri 7:00 AM-10:00 PM ET | Sat 8:00 AM-10:00 PM ET | Sun 7:00 AM-9:00 PM ET