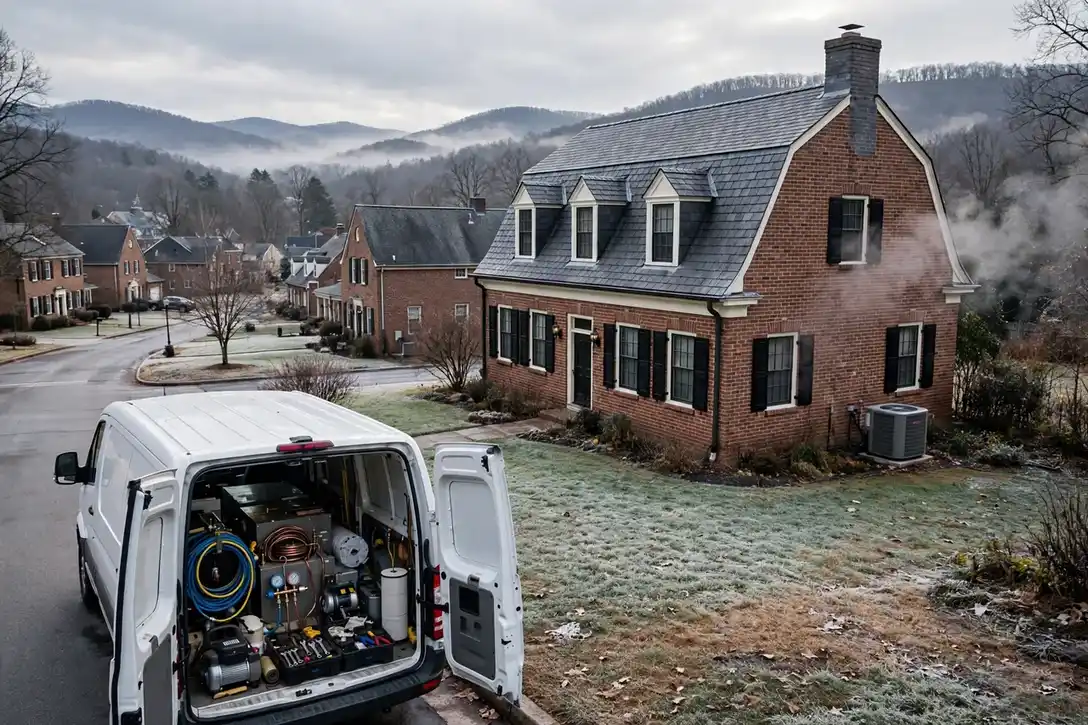


This is Hagerstown's heating and cooling page, built from Hagerstown's own numbers: Census housing figures, the metro's ZIP codes and its NOAA climate record. TempReach USA routes your call to an independent local HVAC technician; the homework below is here so you know your home's likely problems before you ever make it.
Call center hours: Mon-Fri 7:00 AM-10:00 PM ET | Sat 8:00 AM-10:00 PM ET | Sun 7:00 AM-9:00 PM ET
The median Hagerstown home was built in 1984; 44.7% of the stock predates 1980, and the pattern this metro's own data ranks first is the refrigerant transition reaching older systems. TempReach USA is a referral service, not an HVAC company: one call connects you with an independent local HVAC technician serving your ZIP code.
Read Hagerstown through its counties and the picture sharpens. Washington, Berkeley, Morgan were not built in the same decades or for the same households, and their heating and cooling carries those differences: an older core where 25.7% of the metro's homes predate 1960, growth corridors where the subdivisions arrived in waves, and edges still being built out. The metro-wide medians — a middle home built in 1984, 125,658 housing units in all — are the average of those local stories, and the sections below are organised by the patterns the combined record produces, from the oldest equipment generations to the newest failure modes.
There is an equipment timeline buried in Hagerstown's housing figures, and it reads like a technician's diary. The 32,294 homes from before 1960 were heated first and cooled later, their ducts added around floor plans that never imagined them. The 23,875 that followed between 1960 and 1979 mixed those retrofits with the first planned central systems. Then came the 33,299 homes of 1980-1999, fitted with matched systems as standard. Each band of that timeline is now a band of characteristic failures, arriving in the order the equipment tires — which is why a home's build year, in this metro, is the single most predictive fact about its heating and cooling.
The growth side of the metro tells the opposite story in the same language. Martinsburg, Halfway and the subdivisions still filling in account for much of the 36,190 homes built since 2000 — matched systems, planned ductwork, heat pumps where the lots suit them. Their HVAC is not old; it is uniform, which creates its own calendar: everything installed in the same boom reaches each wear point in the same years, from the first condenser replacements to the first control-board failures, while 1,013 cooling degree days of annual heat keep demand on the system high.
The weather's part in this is written at MARTINSBURG E WV RGNL AP, WV US, where an average year carries 38.97 inches of precipitation, 26.2 days at ninety degrees or more and 104.3 nights at freezing or below. Systems experience that year as workload and as stakes in roughly equal measure — the workload in the run hours, the stakes on the single coldest night and the single hottest week. The problem ranking further down is simply the housing profile above, read under this sky.
Two public records, one metro: what was built here, and what the sky does to it.
The distribution, in one breath: of every hundred Hagerstown homes, 25.7 were standing before 1960, 19.0 went up in the two decades after, 26.5 in the two after that, and 28.8 have arrived since 2000. Percentages flatten the picture, so hold the counts beside them — 32,294 oldest-era homes, 36,190 newest — and the metro's heating and cooling stops being an abstraction: it is that many systems, of those ages, failing in that order.
New-stock metros have their own signature, and Hagerstown has it in full: most homes built since 2000, most systems young, most HVAC work a matter of waves — the condenser wave, the control-board wave, the first furnace questions — arriving street by street as identical subdivisions age in lockstep. The older pockets still produce the deepest single jobs, but the metro's HVAC centre of mass sits in its newest postcodes, and every year the waves get closer together.
The runner-up era is 1980-1999, with 26.5% of homes. That stock has left its carefree decades and entered its maintenance decades, and it shows in the call pattern around Martinsburg and the other districts of those years: condensers on their second cycle, furnaces reaching their wear points together, ducts still young enough to reward attention over replacement.
The climate column of this profile is a workload statement. 4,947 heating degree days say how long the cold half of the year keeps furnaces and heat pumps working at their hardest; 1,013 cooling degree days say how relentlessly the hot half loads every condenser and coil; 104.3 freezing nights and 26.2 hot days mark the extremes where the failures concentrate. NOAA keeps these figures at MARTINSBURG E WV RGNL AP, WV US as thirty-year normals — which is to say, as the closest thing HVAC has to a settled forecast.
That is the whole method of this page in one section: era shares from the Census, loads from NOAA, and a problem list that is simply where the two overlap most in Hagerstown. The services and guidance that follow are ordered by the same profile — local first, generic last.
Chosen by this metro's own housing and weather data — the same two records this whole page is built from.
There is a paperwork side to the transition that touches Hagerstown homes quietly. Refrigerant work is regulated work: recovery, handling and record-keeping rules apply to whoever services a system, and the newest refrigerants — mildly flammable by classification — arrive with their own sensors, labeling and code provisions that installers must follow. For the homeowner the visible part is small: a nameplate with a different designation, a technician explaining why a charge is measured and documented as it is, an installation that includes leak-detection provisions the older system never had. The invisible part matters more over time: as the newest generation becomes the metro's standard, parts, training and service practice consolidate around it, and the older generations become the specialty work. Owning an older-generation system is not a fault — but its service ecosystem is, year by year, becoming a smaller room.
A transition-aware service visit has a recognizable order. First, identification: the nameplate's refrigerant, model and year, stated aloud so the household and technician share the fact. Second, the leak question, taken seriously — a system low on charge has a leak until proven otherwise, and recharging without finding it is buying the same refrigerant twice on an installment plan. Third, the condition audit around the failure: compressor health, coil condition, electrical wear, because the decision the household faces is about the whole machine, not the one part that stopped. Fourth, the comparison itself, presented as what it is — the repair path with its realistic horizon, the replacement path with its — so the choice is made on the machine's merits and the household's plans for the home. In Hagerstown that conversation, held in a calm season, is unhurried and genuinely optional-feeling; held in a heat wave, the same facts arrive wearing a deadline.
The climate loads the stakes: a leaking system in Hagerstown underperforms through 26.2 days a year at 90 degrees or more at MARTINSBURG E WV RGNL AP, WV US, so the household pays the transition's toll twice — in refrigerant and in lost cooling — until the underlying decision is made.
Renovation writes its own chapter in this pattern. Homes in Hagerstown have been extended, finished and re-divided for decades — a garage converted, a basement finished, an addition tied into ductwork sized for the original house. Each alteration borrows air from the existing network, and the borrowing is rarely repaid with new capacity or rebalanced runs. The result is a duct system whose map no longer matches the house it serves: original rooms over-supplied, added rooms fed by a hopeful tap into a trunk that was never asked to carry them. Add the slow leaks of age on top of the redesigns of renovation, and the far rooms' complaints stop being mysterious. The remedy starts with honesty about the map — what was designed, what was improvised, and what each run can actually deliver — before any cleaning, sealing or resizing is worth doing.
The construction details explain the timeline. Duct joints are mechanical connections, and the sealants asked to make them permanent have finite lives: cloth-backed tape dries and releases, foil tape lifts at edges, and even mastic can crack where runs move with the building. Flex duct, common in the metro's later building decades, fails at its connections and where its inner liner is pierced or crushed — and a crushed section quietly throttles every room downstream of it. Meanwhile the spaces the ducts cross work against them: attic temperatures in a Hagerstown summer turn an uninsulated or leaking run into a heat exchanger pointed the wrong way, and winter reverses the argument in the crawl space. A duct system is therefore not a fixed asset but a slowly changing one, and its delivered performance in any given year is an empirical question, not a memory of its installation day.
The load figures complete the case: 1,013 cooling degree days and 4,947 heating degree days at MARTINSBURG E WV RGNL AP, WV US mean the network is in service in earnest at both ends of the year. Duct loss here is not a summer inefficiency or a winter one; it is a twelve-month tax on a system that works both seasons.
There is a stage in every system's life when maintenance stops being a formality and becomes the main event. In Hagerstown, with 56,169 pre-1980 homes and the equipment generations stacked inside them, a large part of the metro lives in that stage permanently. The tune-up of an older system is diagnostic work: pressures and temperatures that reveal a thinning refrigerant charge, electrical readings that show a motor working harder than its nameplate allows, a heat exchanger that deserves eyes rather than assumptions. Done yearly, it converts ageing from a surprise generator into a managed slope — the household learns each year what the system spent and what it has left. Skipped for years, the same visit becomes an archaeology dig, and the findings arrive all at once, usually in the season the household could least use them.
Judge an ageing system by its trend line, never by its kindest day. On its kindest day — mild weather, light load — almost any system in Hagerstown can still argue for itself. The trend line is written elsewhere: in run times lengthening season over season, in the setting creeping to hold the same comfort, in the rooms that quietly dropped out of the system's reach. MARTINSBURG E WV RGNL AP, WV US's climate record ensures the trend will be tested at both ends of the year — 26.2 hot days and 104.3 freezing nights in an average year. The households that read their trend early choose the terms of the ending, whether that ending is a renewed component, a planned replacement in a shoulder season, or a few more good years bought with honest maintenance. The households that wait for the system's verdict receive it in the weather least suited to hearing it.
The housing record is the evidence: 25.7% of Hagerstown's homes predate 1960 and 44.7% predate 1980. Equipment lives and ages inside that stock, so the metro's systems are, as a population, exactly as old as its building history says they should be.
The shoulder season is the system's handover, and like any handover it exposes what the outgoing shift left undone. In Hagerstown, the spring shoulder inherits winter's account — a filter loaded with the heating season, an igniter that has fired its thousands, heating symptoms nobody acted on once the weather softened — while the autumn shoulder inherits summer's: a coil washed by months of condensate, a drain carrying the season's growth, starting parts worn by the hot months' work. Clearing each inheritance before the next season draws on the account is the whole craft here, and it is light work precisely because the weather, for these few weeks, is not in a hurry.
The season loads Hagerstown's systems the way its record at MARTINSBURG E WV RGNL AP, WV US says it will: 4,947 heating degree days against 1,013 cooling degree days in an average year, against a housing stock whose median build year is 1984. The households that read the season early — filters, drains, a system run before the extreme weeks — are the ones whose calls stay schedulable.
There is a supply-side depth as well. A shrinking refrigerant does not vanish; it circulates — recovered from retired systems, reclaimed to specification, and returned to service at an expense that reflects the shrinking pool. In Hagerstown that means the R-22 in a system serviced this year may have cooled three other homes before it, and may cool another after this system retires, provided it is recovered rather than vented. The chain gives older equipment a managed twilight rather than a cliff: service remains possible, performed by technicians qualified for the work, for as long as the economics hold for the household. Understanding that chain replaces two common errors — that old systems are already unserviceable, and that they can be serviced forever as cheaply as ever — with the true picture: a gradually tightening supply, a gradually aging fleet, and a decision that improves with information and worsens with delay.
The numbers underneath it, for Hagerstown: 125,658 housing units, a median build year of 1984, and a climate record at MARTINSBURG E WV RGNL AP, WV US of 4,947 heating degree days against 1,013 cooling degree days. Cross the housing record with the weather record and this pattern is what falls out at the top — rarely the most dramatic problem in heating and cooling, but the one this metro's stock and climate manufacture most steadily.
Experienced local practice starts with the simple certainties — the observations that take minutes and decide the most:
Ordered by what this metro's data says its homes need most.
Refrigerant is never consumed, so a low charge in a Hagerstown home means a leak to be found, not just a top-up to be sold; the repair addresses the cause or the symptom is already on its way back.
One more pattern belongs in the Hagerstown picture: repair calls here are also a refrigerant story. Systems fitted in the older decades run on refrigerant generations the industry has been retiring, and every repair on those units weighs the charge's scarcity against the system's remaining life. The technician who explains that arithmetic plainly — what the repair restores, what it cannot assure anyone about next summer — is giving the household the real choice, and in the 56,169 pre-1980 homes it is a conversation held weekly. Locally the workload concentrates where the stock is oldest — the districts built around the 1980s first.
Count the exposure from the Census side: a median build year of 1984 across 125,658 housing units means half the metro's air conditioners are older than the systems in the growth suburbs around Martinsburg, and summer runtime is the statistic that matters — the repair calls follow it street by street.
A duct system remembers everything the house has done: the remodel, the shedding dog, the winter the filter went unchanged. Cleaning reads that memory out under vacuum pressure and leaves the airways themselves — not just the grilles — clean.
What comes out of a Hagerstown duct system tells the home's biography: drywall dust from the renovation, pet hair in proportion to the household, the fine grit that 38.97 inches of yearly rain and the dry seasons between them work into every return. Cleaning matters most where the biography is long — the pre-1980 homes, 44.7% of the stock — and where a household's breathing argues for it. A technician who shows the before and after, and says plainly when a system does not need the work, is the one whose advice holds up. That is the daily reality for the 116,006 households spread across Washington, Berkeley, Morgan.
Count the systems and the diary fills itself: 116,006 households breathing through ductwork daily, the oldest of it in homes from the 1980s and the newest in the subdivisions past Robinwood. What the cleaning finds follows the biography — dust in proportion to years, debris in proportion to renovations.
Honest limits, stated plainly: a tune-up does not make an old system new and cannot prevent every failure. It converts surprises into plans — which, across a system's life, is most of what reliability is made of.
The tune-up diary in Hagerstown follows the installed base: the pre-1980 districts' ageing systems, kept in service by attention; the middle ring's equipment in its second decade, where maintenance decides whether it sees a third; the subdivisions' matched fleets, all reaching the same service points in the same seasons. A maintenance visit is measurement more than ritual — temperatures, pressures, electrical readings, airflow — recorded against last year's figures, so the system's direction is known rather than guessed. Count it in homes if you prefer: 56,169 built before 1980, 36,190 since 2000, one shared system of streets and seasons.
Tune-up demand follows the fleet's waves: the subdivisions' matched systems reaching service points together, the pre-1980 districts' individual units on individual schedules. St. James sits inside one of those patterns; the readings taken there this season predict its systems' next one.
Across Washington, Berkeley, Morgan, the housing split decides the starting point: older, leakier homes around Hagerstown usually need filtration and moisture work first, while tighter newer builds in the 30 covered ZIP codes usually need deliberate ventilation most.
Across 30 ZIP codes, Hagerstown heating stock reflects a median build year of 1984 — furnaces at every age, each diagnosed on its own sequence and condition rather than its birthday.
With a median build year of 1984, many Hagerstown systems are reaching replacement age together; the professional you are connected with inspects ducts and electrics across 30 ZIP codes before recommending equipment.
From Hagerstown to Robinwood, Hagerstown installations routed through TempReach USA finish with commissioning — combustion, temperature rise and airflow verified — so the fitted system is the specified system.
Heat pump services in Hagerstown test the whole year-round system: the independent local professional covering Washington, Berkeley, Morgan reads charge and airflow in both modes, proves defrost, and checks auxiliary heat logic before quoting any work.
Ductless installation in Hagerstown is surveyed room by room across Washington, Berkeley, Morgan: the independent local professional calculates each space's load, plans line and drain routes, and quotes the complete design before work begins.
In Hagerstown, the thermostat question splits by housing era: homes from around the median build year of 1984 often lack a common wire in the wall, while newer builds across the 30 covered ZIP codes usually carry one — the local professional checks the cable before choosing the control.
Across Washington, Berkeley, Morgan, the local professional who answers knows the stock — a median build year of 1984 across 125,658 homes means systems of every age failing in their characteristic ways, from Hagerstown to the metro's newest subdivisions.
Across Washington, Berkeley, Morgan, one climate ledger drives the calendar: 4,947 heating degree days and 1,013 cooling degree days mean roof units work both seasons hard, so the spring and fall visits each carry a full checklist here.
Two patterns generate most of the bookings behind the services above: The refrigerant transition reaching older systems and leaky ducts losing air and energy. That is why the order of this page's service list is what it is — the services answering those patterns come early, and the rest follow in the order the metro's data supports. A homeowner whose home matches the local profile — built in the metro's big decades, in one of its older districts — is, statistically, reading their own shortlist.
PROBLEM SOLUTION
Population 43,490
Population 18,805
Population 10,974
Population 7,822
Population 6,364
Population 4,581
Population 3,799
Population 3,069
Population 3,057
Population 2,660
Population 2,605
Population 2,384
Also in the Hagerstown metro: Williamsport (population 2,133), Hancock (population 1,715).
Read the grid as a building programme spread over a century. The oldest communities sit where the metro began; the youngest are still adding streets at its edge; and Martinsburg and Halfway, with 18,805 and 10,974 residents, stand for the rings in between. Each ring was fitted in its era's equipment, and each is now failing, wearing or holding in its era's characteristic order. The ZIP codes below draw the coverage boundary; the eras inside it draw everything else on this page — the problems ranked, the services ordered, the checks advised.
Also on the Hagerstown map: Robinwood (7,822), Fountainhead-Orchard Hills (6,364), St. James (4,581), Boonsboro (3,799), Smithsburg (3,069) — communities spread across Washington, Berkeley, Morgan, each with housing from its own growth years. A technician routed through TempReach USA to any of them is working from this same page: the metro data does not change at the city limit, but the housing on your street — its age, its equipment, its attic — is what the visit is really about.
Start with Hagerstown itself: 43,490 residents, 14.6% of the metro — the centre the rest of the map orbits. Martinsburg (18,805) and Halfway (10,974) form the next ring out, housing with its own building decades and its own equipment generations. Beyond them the metro thins into the smaller communities in the grid above, each a few thousand households deep — small in population, identical in one respect: their systems answer to the same eras and the same weather as the big city's.
One metro, 3 county lines drawn through it: Washington, Berkeley, Morgan. The lines are invisible to the weather, but they structure everything administrative around an HVAC job — which office permits it, which inspector signs it, which code edition applies. Washington County, at the centre, carries the oldest housing and the heaviest share of the work this page describes; its neighbours carry the growth. A routed local technician navigates the patchwork so the homeowner does not have to.
Beyond the metro line, the nearest covered metros are Baltimore, MD (79 miles away), Lexington Park, MD (114 miles) and Winchester, VA (27 miles) — separate pages, separate profiles, because their housing and weather records are their own. Homeowners near the boundary sit between two datasets; the ZIP list above, not the map's edge, decides which page was written about your stock.
The region around Hagerstown is a set of variations on its theme: Baltimore, MD, 79 miles off, runs a median build year of 1975 on a metro population of 2,857,781; Lexington Park, MD (114 miles) medians 1991 on 211,176; Winchester, VA (27 miles) medians 1989 on 152,332. Nearness is not sameness — a few decades of median build year separate their heating and cooling as surely as the miles separate their maps.
Ratios tell the metro's story compactly. Renters occupy 29.0% of homes; owners hold the rest. For every home built since 2000 there are 1.6 from before 1980. Spread the stock across the coverage map and each ZIP code carries about 4,189 housing units — the density at which era patterns repeat street after street instead of scattering, and at which a routed round of calls stays inside a few districts.
One line of Hagerstown arithmetic — a median home 42 years old · 82,364 owner-occupied homes against 33,642 renter-occupied · 1,076 pre-1960 homes for every covered ZIP code · a heating-to-cooling degree-day ratio of 4.88 · 990 mm of rain in an average year.
County pages carry the local detail — land area, climate normals and the heating and cooling pressures on the ground in each county.
More plain-language help: the TempReach USA heating & cooling guides
TempReach USA routes your call to an independent local heating and cooling professional serving Hagerstown — the assessment and the work are theirs.
Call center hours: Mon-Fri 7:00 AM-10:00 PM ET | Sat 8:00 AM-10:00 PM ET | Sun 7:00 AM-9:00 PM ET