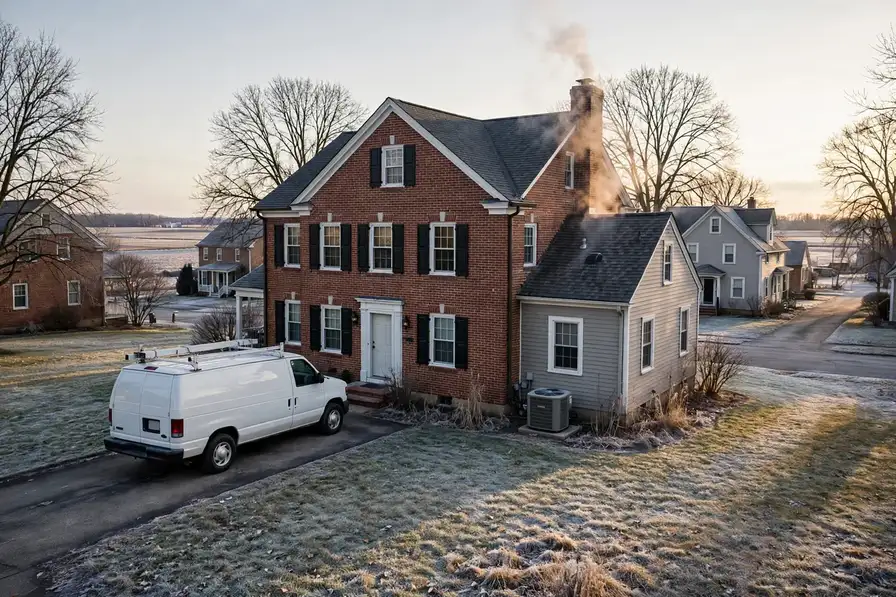


Everything on this page was computed for Des Moines and nowhere else: the problem ranking from its Census housing profile, the seasonal risks from its NOAA station record, the coverage from its own ZIP codes. TempReach USA connects you to an independent local HVAC technician; the page itself is the homework, done in public, so the call you make is an informed one.
Call center hours: Mon-Fri 7:00 AM-10:00 PM ET | Sat 8:00 AM-10:00 PM ET | Sun 7:00 AM-9:00 PM ET
The median Des Moines home was built in 1984; 47.0% of the stock predates 1980, and the pattern this metro's own data ranks first is the refrigerant transition reaching older systems. TempReach USA is a referral service, not an HVAC company: one call connects you with an independent local HVAC technician serving your ZIP code.
Two numbers frame everything that follows: 69.5% of Des Moines homes are owner-occupied, and the median one was built in 1984. Ownership matters to HVAC because owners inherit their systems whole — every equipment decision a builder made in the 1980s or earlier is still in the attic, the closet and the side yard, ageing on its original schedule. With 47.0% of homes predating 1980 and 33.0% arriving since 2000, the metro is really two housing stocks sharing one map, and they are taken separately below before the problems are ranked.
The pre-1980 stock is where most of the metro's HVAC character lives. Homes from those decades in Dallas County and across Dallas, Guthrie, Jasper, Madison, Polk, Warren were built with duct layouts from the first age of central systems, furnaces and condensers that have since been renewed piecemeal, and insulation standards from another era, and each of those choices is now at or beyond the age its makers expected of it. Owner-occupiers hold 69.5% of the metro's homes, so most of the people reading this page are reading about a system they own outright — one whose failures arrive as surprises only if nobody has looked at the pattern: cooling fading a little each summer, a furnace recovering a little more slowly, one room drifting a little further from the thermostat.
The growth side of the metro tells the opposite story in the same language. Ankeny, West Des Moines and the subdivisions still filling in account for much of the 101,873 homes built since 2000 — matched systems, planned ductwork, heat pumps where the lots suit them. Their HVAC is not old; it is uniform, which creates its own calendar: everything installed in the same boom reaches each wear point in the same years, from the first condenser replacements to the first control-board failures, while 1,070 cooling degree days of annual heat keep demand on the system high.
The weather's part in this is written at DES MOINES INTL AP, IA US, where an average year carries 36.55 inches of precipitation, 22.0 days at ninety degrees or more and 127.9 nights at freezing or below. Systems experience that year as workload and as stakes in roughly equal measure — the workload in the run hours, the stakes on the single coldest night and the single hottest week. The problem ranking further down is simply the housing profile above, read under this sky.
Two public records, one metro: what was built here, and what the sky does to it.
Lay the eras side by side instead: 27.1% pre-1960 (83,659 homes), 19.9% from 1960-1979 (61,432), 19.9% from 1980-1999 (61,432), and 33.0% since 2000 (101,873). No single era tells the story — the proportions among them do, and those proportions are different in every metro this site covers.
Read this metro's profile as a before-and-after photograph with the after still developing: the post-2000 band leads, the older bands trail, and every year the balance tips further toward young systems with young problems. Des Moines's HVAC volume already lives in the new stock — its condenser waves, its sensor waves, its heat pump questions — while its deepest single jobs still come from the old core. Both facts are in the numbers above; a local technician's week is simply where they meet.
Behind the leading era sits the founding stock: 83,659 homes from before 1960, 27.1% of the metro. Second place in the table does not mean second place in the workload — those homes carry the oldest system designs in Des Moines, and a disproportionate share of its serious HVAC begins on their streets, in Des Moines's first districts and the suburbs that followed them.
Start the climate half where the system starts: at the thermostat's two seasons. Des Moines's cooling answers 1,070 cooling degree days of load and its heating answers 6,178 heating degree days of cold at DES MOINES INTL AP, IA US — an average temperature of 50.9 degrees that no individual week actually delivers. A heating and cooling system here is never in neutral; the record keeps it working at one end or the other all year.
Hold the two halves together and the rest of this page explains itself: the problems ranked highest here are the ones where Des Moines's dominant housing era and its climate record overlap. Change either dataset and the ranking changes — which is precisely why this profile is rebuilt from the records for every metro instead of carried over from the last one.
Sequenced by this metro's own problem ranking, not by a national catalogue order.
Age informs an AC repair decision without deciding it — a sound system with a failed motor earns its repair, and an honest diagnosis in Des Moines will tell you which side of that line your unit stands on.
Cooling failure in Des Moines is rarely random. It bunches on the first serious heat wave, again in the late-summer grind, and it concentrates where the equipment is oldest — the pre-1980 districts, 47.0% of the metro's housing — and where the newest subdivisions' identical units reach the same wear points in the same seasons. The technician who works these streets stocks the van for both patterns: the ageing system's slow decline and the young fleet's shared failures. Count it in homes if you prefer: 145,091 built before 1980, 101,873 since 2000, one shared system of streets and seasons.
Count the exposure from the Census side: a median build year of 1984 across 308,705 housing units means half the metro's air conditioners are older than the systems in the growth suburbs around Ankeny, and summer runtime is the statistic that matters — the repair calls follow it street by street.
Post-renovation is the clearest case in the trade. Drywall dust and sanding residue settle through every open register, and one thorough cleaning after the work ends removes in hours what the system would otherwise circulate for years.
A word on timing, since Des Moines households ask: duct cleaning earns its appointment when the evidence calls for it — after construction or renovation dust, when a home changes hands after years of one household's accumulation, when the registers show visible load or the blower compartment tells the story. Booked on evidence, it is honest work with visible results. Booked on a calendar superstition, it is a van ride. Local technicians who work from the evidence are the ones this page's routing favours, in Des Moines and across the metro alike. Ask in Urbandale and the answer rhymes with Des Moines: same eras, same equipment generations, same calendar of failures.
Duct demand concentrates in the metro's long-biography homes: 145,091 pre-1980 systems that have carried decades of household air, and the renovated homes around Urbandale (46,026 residents) whose construction dust is still in the runs.
Furnaces rehearse their failures: second-attempt ignition, shortening cycles, a louder blower. In Des Moines those early signs are the cheapest version of the repair, caught while the house is still warm.
There is a safety grammar to furnace repair in Des Moines that every visit observes: combustion checked, venting verified, the exchanger's integrity read before comfort is discussed. A cracked exchanger or a lazy flame is not a comfort fault wearing a disguise; it is the one finding that changes the visit's whole direction. In a metro where 145,091 homes predate 1980 and their furnaces have been swapped into ageing duct systems more than once, that grammar is the difference between a repair and a recommendation — and honest technicians here will show the homeowner the evidence either way. Locally the workload concentrates where the stock is oldest — the districts built around the 1980s first.
Under Des Moines's winters lie 6,178 heating degree days a year, and the furnaces answering them include the ageing units of the 145,091 pre-1980 homes alongside the electronic systems of the new subdivisions. The repair diary in Johnston reads both ends of that stock in a single week.
A tune-up is scheduled while the system still works, which is the entire point: measurements taken in mild weather find the parts that hard weather would have found instead, at its own chosen hour.
Maintenance in Des Moines is a calendar with two appointments a year, written by the climate: one before the 22.0 hot days arrive, one before the 127.9 freezing nights do. The cooling visit works the outdoor unit — coils washed, refrigerant pressures read, capacitors and contactors tested, the condensate drain cleared before the humid weeks can clog it. The heating visit works the furnace or heat pump — burners and ignition, the exchanger's condition, venting, airflow. Between them they catch the failures this metro's systems rehearse every year, while those failures are still small. That is the daily reality for the 289,451 households spread across Dallas, Guthrie, Jasper, Madison, Polk, Warren.
Tune-up demand follows the fleet's waves: the subdivisions' matched systems reaching service points together, the pre-1980 districts' individual units on individual schedules. Clive sits inside one of those patterns; the readings taken there this season predict its systems' next one.
One call from anywhere in Des Moines's 92 covered ZIP codes reaches the routing: the failure's details taken, safety advice given on the spot, and the visit sequenced the same way everywhere — safety, stabilization, diagnosis, then repair or an honest scope.
With a median build year of 1984, many Des Moines systems are reaching replacement age together; the professional you are connected with inspects ducts and electrics across 92 ZIP codes before recommending equipment.
With 308,705 homes and a median build year of 1984, Des Moines heating stock spans every era of furnace and flue — each installation assessed on its own house, not on the outgoing unit's label.
Across 92 ZIP codes and housing from a median build year of 1984, Des Moines heat pumps are specified and serviced from heat-loss figures and low-temperature performance data, not nominal tonnage.
Across 92 ZIP codes, Des Moines mini-split systems installed through local professionals are commissioned zone by zone in heating and cooling, with the filter and drain routine handed over in person.
Across Dallas, Guthrie, Jasper, Madison, Polk, Warren, the housing split decides the starting point: older, leakier homes around Des Moines usually need filtration and moisture work first, while tighter newer builds in the 92 covered ZIP codes usually need deliberate ventilation most.
Across Dallas, Guthrie, Jasper, Madison, Polk, Warren, one climate fact shapes the configuration: 6,178 heating degree days against 1,070 cooling degree days tells whether the control's year is mostly a heating story, mostly a cooling story, or a genuine heat pump balancing act.
Des Moines's commercial buildings span every era around a median build year of 1984 — and with the era goes the equipment, from aging single units over old storefronts to multi-zone systems in new developments, all serviced from a per-unit record.
There is a plainer way to say what this page's ranking means in practice: most calls in Des Moines are two calls. The first answers The refrigerant transition reaching older systems; the second answers leaky ducts losing air and energy. Between them they account for the shape of a local technician's week here — the districts visited, the parts stocked, the diagnoses made fastest because they are made most often. The remaining services divide the rest of the diary among them, essential but episodic, the supporting work around two leading patterns.
Selected and ranked from this metro's housing-age profile and climate record — not copied from another city's page.
Planning is where households regain the advantage. A Des Moines homeowner who knows their system's refrigerant, age and repair history can run the transition on their own schedule: service the current machine properly, watch the leak-and-wear indicators, and time any replacement for a shoulder season, chosen equipment and an unhurried installation. The homeowner who meets the transition for the first time through a breakdown meets it on the calendar's worst terms — mid-heat, limited deliberation, a decision between an expensive charge on an old machine and a replacement nobody had budgeted to choose that week. The transition itself is the same in both stories; the difference is purely when the household chose to read the nameplate. Technicians in this metro can recite both versions from memory, street by street, because the metro's equipment generations were installed street by street.
Judge a refrigerant-era system by its leak history and its trend, not by a single charge reading. One low reading after many tight years is an event; a pattern of small losses is a biography, and the biography is what the economics should be based on. Des Moines's climate record loads the question at both ends — a leaking system underperforms exactly when DES MOINES INTL AP, IA US's 22.0 hot days demand its full capacity, and its owner pays for refrigerant and lost performance simultaneously. The households that navigate this transition well keep one habit: they can state their system's age, refrigerant and last three repairs without looking them up. That small command of the facts converts an industry-wide generational change into a single household's managed decision, which is the scale at which it was always going to be decided anyway.
The climate loads the stakes: a leaking system in Des Moines underperforms through 22.0 days a year at 90 degrees or more at DES MOINES INTL AP, IA US, so the household pays the transition's toll twice — in refrigerant and in lost cooling — until the underlying decision is made.
Duct loss hides inside other complaints. It presents as an air conditioner that cannot keep up in July — because the supply run through the attic is delivering air that picked up heat the whole way there. It presents as dust that returns days after cleaning, drawn in through return leaks in the crawl space. It presents as a furnace that heats the basement ceiling handsomely and the bedrooms modestly. In Des Moines, where many homes route their ducts outside the conditioned envelope by design of their era, these presentations are common enough to have a standing place in a technician's first questions. Separating duct loss from equipment weakness takes measurement rather than opinion — pressures and temperatures at the registers compared with those at the unit — and the separation matters, because the remedies are entirely different and only one of them touches the actual loss.
The construction details explain the timeline. Duct joints are mechanical connections, and the sealants asked to make them permanent have finite lives: cloth-backed tape dries and releases, foil tape lifts at edges, and even mastic can crack where runs move with the building. Flex duct, common in the metro's later building decades, fails at its connections and where its inner liner is pierced or crushed — and a crushed section quietly throttles every room downstream of it. Meanwhile the spaces the ducts cross work against them: attic temperatures in a Des Moines summer turn an uninsulated or leaking run into a heat exchanger pointed the wrong way, and winter reverses the argument in the crawl space. A duct system is therefore not a fixed asset but a slowly changing one, and its delivered performance in any given year is an empirical question, not a memory of its installation day.
Consider the delivery assumption: every system in Des Moines was sized on the expectation that its air would arrive. With 47.0% of homes built before 1980 — and their networks renovated, extended and re-sealed by turns ever since — that expectation's reliability varies house by house, which is why the measurement, not the assumption, has to govern.
There is a pattern to which furnaces fail in a cold snap: it is the ones that were already negotiating. The unit that locked out twice in December and recovered, the one whose blower grew loud in the season's first month, the one heating an the 1980s home whose ductwork was never generous — the snap does not create their problems, it schedules them simultaneously. In Des Moines a hard cold week therefore reads like a census of deferred maintenance, street by street. The households absent from that census share a habit rather than a budget: their furnaces were looked at before the season turned, by someone who treats an igniter's resistance reading and a flame sensor's condition as the forecasts they are.
The wear itself follows the physics of the machine. A gas furnace lives by controlled fire: it must move air across a heat exchanger that swings from room temperature to several hundred degrees and back, many times a day, all winter. Metal fatigues under that cycling — slowly, invisibly, and faster in a unit that short-cycles because of a dirty filter or an oversized installation. Ignition components live an equally hard life at the small scale: a hot-surface igniter is a ceramic element heated to glowing in seconds, and each heating is a thermal shock. In Des Moines's 6,178 heating degree days, a furnace may fire tens of thousands of times across its life. The season's failures are rarely mysteries; they are the arithmetic of cycles, arriving on schedule in the coldest weeks because that is when the cycles concentrate.
Housing adds its evidence: with a median build year of 1984, much of Des Moines's heating plant serves homes whose ductwork and insulation ask more per cold night than modern construction would. The furnace wears against the house as well as the weather.
What ageing systems reward, above all, is records. A Des Moines household that can say when its system was installed, what has been replaced, and what last year's readings were gives a technician a running machine to assess rather than a mystery to open. The metro's housing makes this more valuable, not less: with 308,705 housing units and equipment of every era in service, the difference between a system with a history and one without is the difference between a plan and a guess. Age itself is not the enemy — plenty of well-kept systems in this metro heat and cool reliably deep into their second decade and beyond. Unrecorded, unmeasured age is the enemy, because it converts a manageable slope into a cliff edge that only reveals itself in extreme weather, when every option is at its most expensive in time and trouble.
A serious look at an ageing system follows a short order. First, identity: the nameplate's age, model and refrigerant, because those three facts set the realistic horizon. Second, the electrical profile: starting components, motor draws, the condition of connections and the disconnect. Third, the air side: filter, coil cleanliness, blower condition and the temperatures across the system, which together say whether the machine is moving its rated air. Fourth, the combustion side on heating equipment: ignition condition, flame quality, exchanger inspection and venting. Last, the conversation those readings support — what is sound, what is spent, what to watch, and what the household should plan for in which season. In Des Moines's older housing that order matters more, not less, because the findings compound: an old system behind dirty coils and a drifting charge is three small problems impersonating one large one.
Look at the replacement echoes: the 101,873 homes built since 2000 are now carrying first-generation equipment deep into its service life, joining the older cohorts. In Des Moines, ageing is not a niche condition of old houses; it is the metro's standard equipment profile.
Living with a real winter, as Des Moines does, means the season has a shape: the first hard freeze finds the unprepared systems, mid-winter tests endurance — igniters, motors and sensors carrying months of cycles — and the late thaws reveal what the cold quietly damaged. Households that prove their heating in autumn and treat mid-season symptoms as scheduling information get through most winters with nothing dramatic to report; the drama concentrates, year after year, in the systems nobody ran until the night they were needed at full load.
The season loads Des Moines's systems the way its record at DES MOINES INTL AP, IA US says it will: 6,178 heating degree days against 1,070 cooling degree days in an average year, against a housing stock whose median build year is 1984. The households that read the season early — filters, drains, a system run before the extreme weeks — are the ones whose calls stay schedulable.
There is a supply-side depth as well. A shrinking refrigerant does not vanish; it circulates — recovered from retired systems, reclaimed to specification, and returned to service at an expense that reflects the shrinking pool. In Des Moines that means the R-22 in a system serviced this year may have cooled three other homes before it, and may cool another after this system retires, provided it is recovered rather than vented. The chain gives older equipment a managed twilight rather than a cliff: service remains possible, performed by technicians qualified for the work, for as long as the economics hold for the household. Understanding that chain replaces two common errors — that old systems are already unserviceable, and that they can be serviced forever as cheaply as ever — with the true picture: a gradually tightening supply, a gradually aging fleet, and a decision that improves with information and worsens with delay.
Why here and not everywhere: Des Moines pairs 145,091 pre-1980 homes with 22.0 days a year at 90 degrees or more and 127.9 nights below freezing. Every metro pairs its housing with its weather somehow; this particular pairing is what puts the pattern where it sits on this page's list, ahead of problems that dominate metros built in other decades, under other skies.
On a first visit for this pattern, a local technician's checks run in a practised order:
PROBLEM SOLUTION
Population 212,464
Population 70,542
Population 69,893
Population 46,026
Population 26,974
Population 24,196
Population 20,592
Population 18,776
Population 15,918
Population 15,810
Population 15,696
Population 13,610
Also in the Des Moines metro: Pleasant Hill (population 10,796), Bondurant (population 8,061).
Beyond Des Moines itself, the metro takes in Ankeny (70,542 residents), West Des Moines (69,893) and the rest of the communities in the grid above — each fitted with heating and cooling in its own building era, which is why two streets in the same metro can need entirely different HVAC conversations. The ZIP list below is the full coverage footprint: if your code is on it, this page was written about your housing stock.
Also on the Des Moines map: Urbandale (46,026), Waukee (26,974), Johnston (24,196), Altoona (20,592), Clive (18,776) — communities spread across Dallas, Guthrie, Jasper, Madison, Polk, Warren, each with housing from its own growth years. A technician routed through TempReach USA to any of them is working from this same page: the metro data does not change at the city limit, but the housing on your street — its age, its equipment, its attic — is what the visit is really about.
The metro's weight is not evenly spread. Des Moines holds 212,464 of the 720,331 residents; Ankeny and West Des Moines add 70,542 and 69,893; and the remainder scatters across the smaller places above, some no bigger than a few thousand people. HVAC follows the weight — most calls come from where most homes are — but era matters more than size: a small community of 1960s housing generates older-system work than a large new subdivision does.
Administratively the metro is drawn from Dallas, Guthrie, Jasper, Madison, Polk, Warren — 6 in all — with Dallas County at its centre. County lines do not change how a system runs, but they do shape the paperwork around the work: permits, inspections and code details are county and city business, which is one reason the professional who serves your street is a local one.
Three neighbouring coverage areas begin where this one ends: Waterloo, IA, some 96 miles off; Iowa City, IA, 110 miles; and Cedar Rapids, IA, 119 miles. Each keeps its own page because each keeps its own numbers — a different median build year, a different climate station, a different problem ranking. Boundary households should trust the ZIP list over the map: the code, not the compass, assigns the dataset.
Set Des Moines among its neighbours and the contrasts sharpen the profile: Waterloo, IA — metro population 169,189, median build year 1966 — sits 96 miles away; Iowa City, IA (182,711, median 1988) 110 miles; Cedar Rapids, IA (279,285, median 1976) 119 miles. Three different housing stocks under three nearby skies, which is why each keeps its own page and its own problem ranking rather than borrowing this one.
Ratios tell the metro's story compactly. Renters occupy 30.5% of homes; owners hold the rest. For every home built since 2000 there are 1.4 from before 1980. Spread the stock across the coverage map and each ZIP code carries about 3,355 housing units — the density at which era patterns repeat street after street instead of scattering, and at which a routed round of calls stays inside a few districts.
Des Moines by the derived numbers — median home age 42 years · owners in 201,168 homes, renters in 88,283 · each covered ZIP code carrying about 909 pre-1960 homes · a heating-to-cooling degree-day ratio of 5.77 · 928 mm average annual rainfall.
County pages carry the local detail — land area, climate normals and the heating and cooling pressures on the ground in each county.
More plain-language help: the TempReach USA heating & cooling guides
One call connects you with an independent local heating and cooling professional serving Des Moines and the surrounding metro.
Call center hours: Mon-Fri 7:00 AM-10:00 PM ET | Sat 8:00 AM-10:00 PM ET | Sun 7:00 AM-9:00 PM ET