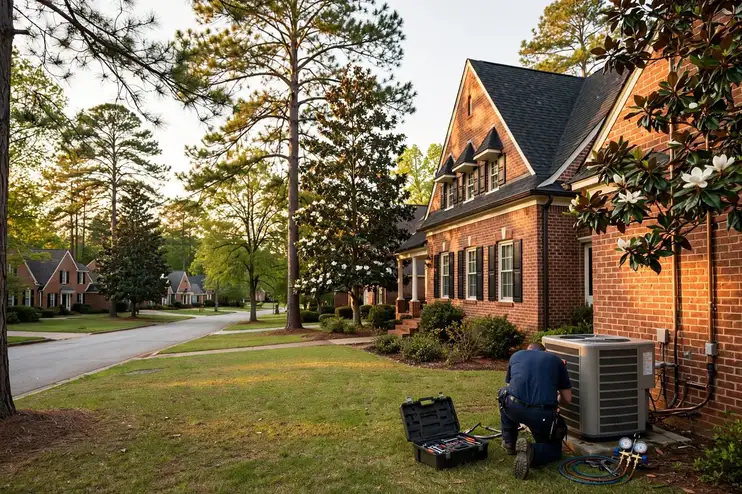


Everything on this page was computed for Dalton and nowhere else: the problem ranking from its Census housing profile, the seasonal risks from its NOAA station record, the coverage from its own ZIP codes. TempReach USA connects you to an independent local HVAC technician; the page itself is the homework, done in public, so the call you make is an informed one.
Call center hours: Mon-Fri 7:00 AM-10:00 PM ET | Sat 8:00 AM-10:00 PM ET | Sun 7:00 AM-9:00 PM ET
The median Dalton home was built in 1989; 34.2% of the stock predates 1980, and the pattern this metro's own data ranks first is the refrigerant transition reaching older systems. TempReach USA is a referral service, not an HVAC company: one call connects you with an independent local HVAC technician serving your ZIP code.
Dalton is a metro of 143,400 people and 51,359 households, and its heating and cooling is a portrait of its building history. The median home here was built in 1989; 34.2% of homes predate 1980 and 11.5% predate 1960, while 26.9% have arrived since 2000. Every one of those eras heated and cooled differently — different furnaces, different duct designs, different refrigerant generations — and they fail differently, which is why this page is organised around the patterns the data actually produces in Dalton rather than HVAC in the abstract.
The pre-1980 stock is where most of the metro's HVAC character lives. Homes from those decades in Murray County and across Murray, Whitfield were built with duct layouts from the first age of central systems, furnaces and condensers that have since been renewed piecemeal, and insulation standards from another era, and each of those choices is now at or beyond the age its makers expected of it. Owner-occupiers hold 69.6% of the metro's homes, so most of the people reading this page are reading about a system they own outright — one whose failures arrive as surprises only if nobody has looked at the pattern: cooling fading a little each summer, a furnace recovering a little more slowly, one room drifting a little further from the thermostat.
The growth side of the metro tells the opposite story in the same language. Chatsworth, Varnell and the subdivisions still filling in account for much of the 14,961 homes built since 2000 — matched systems, planned ductwork, heat pumps where the lots suit them. Their HVAC is not old; it is uniform, which creates its own calendar: everything installed in the same boom reaches each wear point in the same years, from the first condenser replacements to the first control-board failures, while 1,921 cooling degree days of annual heat keep demand on the system high.
The climate written over all of it comes from the NOAA station at CHATTANOOGA LOVELL AP, TN US: an average year brings 3,029 heating degree days, 1,921 cooling degree days and 55.0 inches of precipitation. Those are not abstractions to a furnace or a condenser — they set how many hours a heating system runs each winter, how hard a cooling system cycles in July, and how much moisture every coil has to pull out of the indoor air. The problem sections that follow are selected by exactly these numbers, combined with the housing-age profile above.
The metro's building eras on one side, its weather record on the other — and its heating and cooling where the two meet.
Lay the eras side by side instead: 11.5% pre-1960 (6,396 homes), 22.7% from 1960-1979 (12,625), 39.0% from 1980-1999 (21,691), and 26.9% since 2000 (14,961). No single era tells the story — the proportions among them do, and those proportions are different in every metro this site covers.
The 1980-1999 band runs this metro, and its HVAC has a particular flavour: mature but not ancient. Systems old enough to have histories, ducts still sound, equipment from the first efficiency era reaching its wear points in waves, condensers cycling through replacements on a schedule set by whole subdivisions. Dalton's is a maintenance-era stock — the decades where attention compounds and neglect starts to invoice.
The second-largest band is the newest: 14,961 homes built since 2000, 26.9% of the metro. Young stock writes young HVAC — condenser waves, control waves, the first heat pump questions — arriving street by street as uniform subdivisions age in lockstep around Chatsworth and the growth edge. It is the metro's future workload, visible early to anyone reading the table.
Translate the climate record into HVAC terms and it comes out as three working conditions. Condition one, the freeze count — 56.2 nights a year when a heating failure stops being a comfort issue and becomes a household one. Condition two, the heat count — 57.8 days that load condensers, ducts and tempers simultaneously. Condition three, the moisture: 55.0 inches of precipitation arriving as humidity the cooling coil must remove. Dalton's systems are engineered, installed and aged inside those three conditions, and their failures carry the conditions' fingerprints.
Hold the two halves together and the rest of this page explains itself: the problems ranked highest here are the ones where Dalton's dominant housing era and its climate record overlap. Change either dataset and the ranking changes — which is precisely why this profile is rebuilt from the records for every metro instead of carried over from the last one.
Ordered by what this metro's data says its homes need most.
Age informs an AC repair decision without deciding it — a sound system with a failed motor earns its repair, and an honest diagnosis in Dalton will tell you which side of that line your unit stands on.
Cooling failure in Dalton is rarely random. It bunches on the first serious heat wave, again in the late-summer grind, and it concentrates where the equipment is oldest — the pre-1980 districts, 34.2% of the metro's housing — and where the newest subdivisions' identical units reach the same wear points in the same seasons. The technician who works these streets stocks the van for both patterns: the ageing system's slow decline and the young fleet's shared failures. In Dalton that holds across 11 ZIP codes, from Dalton out to Varnell.
The local caseload behind this service is written in the climate figures: 1,921 cooling degree days a year and 57.8 days at 90 or above, pressing on a cooling fleet whose oldest members serve the 19,021 pre-1980 homes — in Chatsworth (4,857 residents) as much as in the oldest districts.
Three parts, one system: filtration captures what the air carries, humidity control keeps moisture where the building tolerates it, and ventilation replaces stale air on schedule. Equipment chosen for one part cannot do the others' work.
The air quality conversation in Dalton starts with humidity more often than with gadgets. A home whose summer indoor humidity rides high grows musty at the coil and uncomfortable at the thermostat, and a home dried out by 3,029 heating degree days of winter runtime irritates skin, wood and sinuses in the opposite direction. The assessment measures before it prescribes: humidity in both seasons, the filter's actual condition and fit, the duct leakage that pulls attic or crawl-space air into the supply stream in the metro's older districts. The CHATTANOOGA LOVELL AP, TN US record — 3,029 heating degree days, 1,921 cooling — is the backdrop Murray County technicians plan around.
Air quality demand in this metro is written by its sealed seasons: 57.8 hot days with the windows shut around the cooling, 56.2 freezing nights with them shut around the heat. The 14,961 post-2000 homes hold their air tightest; the older districts around Tunnel Hill exchange theirs with attics and crawl spaces.
Post-renovation is the clearest case in the trade. Drywall dust and sanding residue settle through every open register, and one thorough cleaning after the work ends removes in hours what the system would otherwise circulate for years.
Duct cleaning in Dalton is booked in waves that follow the housing: after the renovation seasons in the older districts, at move-in across the subdivisions, alongside system replacements everywhere. The work pairs naturally with the inspection that surrounds it — leaking joints found and sealed, a disconnected run in an attic discovered, insulation fallen where it should not be. The cleaning is the appointment; the findings are often the value. With a median build year of 1989, most of the metro's 55,617 housing units are working through the same ageing curve.
Count the systems and the diary fills itself: 51,359 households breathing through ductwork daily, the oldest of it in homes from the 1980s and the newest in the subdivisions past Eton. What the cleaning finds follows the biography — dust in proportion to years, debris in proportion to renovations.
From period homes near Dalton to newer builds toward Tunnel Hill, Dalton's ductless projects serve the rooms central systems miss — additions, conversions and homes built without ductwork.
With a median build year of 1989, many Dalton systems are reaching replacement age together; the professional you are connected with inspects ducts and electrics across 11 ZIP codes before recommending equipment.
Across 11 ZIP codes, Dalton heating stock reflects a median build year of 1989 — furnaces at every age, each diagnosed on its own sequence and condition rather than its birthday.
Heating installation in Dalton starts with a heat-loss calculation across Murray, Whitfield: the independent local professional measures the home's loss, inspects ducts and venting, and quotes the full scope before work begins.
Heat pump services in Dalton test the whole year-round system: the independent local professional covering Murray, Whitfield reads charge and airflow in both modes, proves defrost, and checks auxiliary heat logic before quoting any work.
Across Murray, Whitfield, one climate fact shapes the configuration: 3,029 heating degree days against 1,921 cooling degree days tells whether the control's year is mostly a heating story, mostly a cooling story, or a genuine heat pump balancing act.
Across Murray, Whitfield, the service record is the scarcest asset: with a median build year of 1989 across 55,617 homes, many systems around Dalton have no documented history — and a first tune-up's baseline is what every later decision stands on.
One call from anywhere in Dalton's 11 covered ZIP codes reaches the routing: the failure's details taken, safety advice given on the spot, and the visit sequenced the same way everywhere — safety, stabilization, diagnosis, then repair or an honest scope.
Dalton's commercial buildings span every era around a median build year of 1989 — and with the era goes the equipment, from aging single units over old storefronts to multi-zone systems in new developments, all serviced from a per-unit record.
There is a plainer way to say what this page's ranking means in practice: most calls in Dalton are two calls. The first answers The refrigerant transition reaching older systems; the second answers humidity burden on homes and cooling systems. Between them they account for the shape of a local technician's week here — the districts visited, the parts stocked, the diagnoses made fastest because they are made most often. The remaining services divide the rest of the diary among them, essential but episodic, the supporting work around two leading patterns.
Chosen by this metro's own housing and weather data — the same two records this whole page is built from.
Planning is where households regain the advantage. A Dalton homeowner who knows their system's refrigerant, age and repair history can run the transition on their own schedule: service the current machine properly, watch the leak-and-wear indicators, and time any replacement for a shoulder season, chosen equipment and an unhurried installation. The homeowner who meets the transition for the first time through a breakdown meets it on the calendar's worst terms — mid-heat, limited deliberation, a decision between an expensive charge on an old machine and a replacement nobody had budgeted to choose that week. The transition itself is the same in both stories; the difference is purely when the household chose to read the nameplate. Technicians in this metro can recite both versions from memory, street by street, because the metro's equipment generations were installed street by street.
Judge a refrigerant-era system by its leak history and its trend, not by a single charge reading. One low reading after many tight years is an event; a pattern of small losses is a biography, and the biography is what the economics should be based on. Dalton's climate record loads the question at both ends — a leaking system underperforms exactly when CHATTANOOGA LOVELL AP, TN US's 57.8 hot days demand its full capacity, and its owner pays for refrigerant and lost performance simultaneously. The households that navigate this transition well keep one habit: they can state their system's age, refrigerant and last three repairs without looking them up. That small command of the facts converts an industry-wide generational change into a single household's managed decision, which is the scale at which it was always going to be decided anyway.
Housing arithmetic shows the exposure: with 34.2% of Dalton's homes built before 1980 and equipment replaced in long cycles ever since, a substantial share of the metro's systems belong to refrigerant generations the market has already succeeded. The nameplates say so, one address at a time.
Cooling and drying are two jobs wearing one name, and in Dalton the second job is the heavier one for much of the season. The climate record at CHATTANOOGA LOVELL AP, TN US pairs the heat with 55.0 inches of precipitation in an average year, and the air that comes with that moisture asks every air conditioner to do double duty: lower the temperature and wring out the water. A system dries air only while it runs, and only when its coil is cold and its airflow is right — so a unit that satisfies the thermostat quickly and shuts off can leave a house cool and clammy at the same time. The burden shows in the house as much as in the equipment: rooms that feel sticky at a normal setting, a musty note in closets and low corners, condensation on registers and windows, and indoor air that never quite feels finished. Households often answer by turning the thermostat down, which buys dryness with overcooling and longer bills of runtime. The underlying question is a moisture question — where the water is entering, how the system is set up to remove it, and whether the house needs dedicated dehumidification help beyond its cooling cycle.
Judge a home's moisture by its wettest week, not its average one. Averages flatter: in Dalton, an average year at CHATTANOOGA LOVELL AP, TN US delivers 55.0 inches of rain, but the burden arrives in episodes — the saturated stretch when the ground is wet, the air is wet, and the house's every surface is trading moisture with both. In that week the closet smells, the registers sweat, and the system's drying margin is audited honestly. The homes that pass the audit share a profile rather than a product: sources managed, a system sized and set up to run long enough to dry, a drain that carries the evidence away, and occupants who read indoor humidity the way they read temperature. Moisture problems are patient; they wait for the wet week. The preparation that defeats them is exactly as patient, and considerably cheaper in attention than in consequence.
Count the load the way the coil experiences it: through the humid months, each pass of indoor air delivers moisture that must condense and drain before the air can feel finished. In Dalton, where cooling degree days reach 1,921 a year, that invisible water work rivals the temperature work the system was named for.
A duct system is a delivery network, and in many Dalton homes it leaks like one. Supply runs carry conditioned air through attics, crawl spaces and wall cavities on their way to the registers; return runs carry it back. Every joint, seam and connection along those paths is a chance for the air to leave early or for unconditioned air to be pulled in, and older installations — assembled with tape that has long since dried out, or sections that have sagged apart — leak at many of them at once. The system responds the only way it can: by running longer to deliver the same comfort, which is why duct loss so often disguises itself as an equipment problem. The furnace and air conditioner get blamed, serviced, sometimes replaced, while the network between them quietly spills a share of every run into the attic. In Dalton's housing, where duct runs cross some of the hottest and coldest spaces in the home, a leak counts double: the air is lost, and the air that remains arrives changed by the space it traveled through.
The construction details explain the timeline. Duct joints are mechanical connections, and the sealants asked to make them permanent have finite lives: cloth-backed tape dries and releases, foil tape lifts at edges, and even mastic can crack where runs move with the building. Flex duct, common in the metro's later building decades, fails at its connections and where its inner liner is pierced or crushed — and a crushed section quietly throttles every room downstream of it. Meanwhile the spaces the ducts cross work against them: attic temperatures in a Dalton summer turn an uninsulated or leaking run into a heat exchanger pointed the wrong way, and winter reverses the argument in the crawl space. A duct system is therefore not a fixed asset but a slowly changing one, and its delivered performance in any given year is an empirical question, not a memory of its installation day.
Consider the delivery assumption: every system in Dalton was sized on the expectation that its air would arrive. With 34.2% of homes built before 1980 — and their networks renovated, extended and re-sealed by turns ever since — that expectation's reliability varies house by house, which is why the measurement, not the assumption, has to govern.
The shoulder season is the system's handover, and like any handover it exposes what the outgoing shift left undone. In Dalton, the spring shoulder inherits winter's account — a filter loaded with the heating season, an igniter that has fired its thousands, heating symptoms nobody acted on once the weather softened — while the autumn shoulder inherits summer's: a coil washed by months of condensate, a drain carrying the season's growth, starting parts worn by the hot months' work. Clearing each inheritance before the next season draws on the account is the whole craft here, and it is light work precisely because the weather, for these few weeks, is not in a hurry.
The season loads Dalton's systems the way its record at CHATTANOOGA LOVELL AP, TN US says it will: 3,029 heating degree days against 1,921 cooling degree days in an average year, against a housing stock whose median build year is 1989. The households that read the season early — filters, drains, a system run before the extreme weeks — are the ones whose calls stay schedulable.
There is a supply-side depth as well. A shrinking refrigerant does not vanish; it circulates — recovered from retired systems, reclaimed to specification, and returned to service at an expense that reflects the shrinking pool. In Dalton that means the R-22 in a system serviced this year may have cooled three other homes before it, and may cool another after this system retires, provided it is recovered rather than vented. The chain gives older equipment a managed twilight rather than a cliff: service remains possible, performed by technicians qualified for the work, for as long as the economics hold for the household. Understanding that chain replaces two common errors — that old systems are already unserviceable, and that they can be serviced forever as cheaply as ever — with the true picture: a gradually tightening supply, a gradually aging fleet, and a decision that improves with information and worsens with delay.
Why here and not everywhere: Dalton pairs 19,021 pre-1980 homes with 57.8 days a year at 90 degrees or more and 56.2 nights below freezing. Every metro pairs its housing with its weather somehow; this particular pairing is what puts the pattern where it sits on this page's list, ahead of problems that dominate metros built in other decades, under other skies.
The first visit follows a short, diagnostic list — each item ruling a branch of the problem in or out:
PROBLEM SOLUTION
Population 34,402
Population 4,857
Population 2,623
Population 1,122
Population 1,018
Population 961
Beyond Dalton itself, the metro takes in Chatsworth (4,857 residents), Varnell (2,623) and the rest of the communities in the grid above — each fitted with heating and cooling in its own building era, which is why two streets in the same metro can need entirely different HVAC conversations. The ZIP list below is the full coverage footprint: if your code is on it, this page was written about your housing stock.
Beyond the largest communities sit Tunnel Hill (1,122), Cohutta (1,018), Eton (961) — smaller places across Murray, Whitfield, covered on the same terms. Their housing tends to be older on average than the big suburbs', and their calls follow the older patterns on this page. One routing covers them all: find your ZIP code below and the rest is a phone call.
The metro's weight is not evenly spread. Dalton holds 34,402 of the 143,400 residents; Chatsworth and Varnell add 4,857 and 2,623; and the remainder scatters across the smaller places above, some no bigger than a few thousand people. HVAC follows the weight — most calls come from where most homes are — but era matters more than size: a small community of 1960s housing generates older-system work than a large new subdivision does.
One metro, 2 county lines drawn through it: Murray, Whitfield. The lines are invisible to the weather, but they structure everything administrative around an HVAC job — which office permits it, which inspector signs it, which code edition applies. Murray County, at the centre, carries the oldest housing and the heaviest share of the work this page describes; its neighbours carry the growth. A routed local technician navigates the patchwork so the homeowner does not have to.
Beyond the metro line, the nearest covered metros are Gainesville, GA (68 miles away), Atlanta, GA (79 miles) and Athens, GA (108 miles) — separate pages, separate profiles, because their housing and weather records are their own. Homeowners near the boundary sit between two datasets; the ZIP list above, not the map's edge, decides which page was written about your stock.
Set Dalton among its neighbours and the contrasts sharpen the profile: Gainesville, GA — metro population 226,568, median build year 1995 — sits 68 miles away; Atlanta, GA (6,482,182, median 1993) 79 miles; Athens, GA (224,148, median 1990) 108 miles. Three different housing stocks under three nearby skies, which is why each keeps its own page and its own problem ranking rather than borrowing this one.
Ratios tell the metro's story compactly. Renters occupy 30.4% of homes; owners hold the rest. For every home built since 2000 there are 1.3 from before 1980. Spread the stock across the coverage map and each ZIP code carries about 5,056 housing units — the density at which era patterns repeat street after street instead of scattering, and at which a routed round of calls stays inside a few districts.
The Dalton record in one line — median home age: 37 years · owner-occupied homes: 35,746 · renter-occupied homes: 15,613 · pre-1960 homes per covered ZIP code: 581 · heating-to-cooling degree-day ratio: 1.58 · average rainfall: 1,397 mm a year.
County pages carry the local detail — land area, climate normals and the heating and cooling pressures on the ground in each county.
More plain-language help: the TempReach USA heating & cooling guides
Describe the problem and the call center routes you to an independent local HVAC technician who works in the Dalton metro.
Call center hours: Mon-Fri 7:00 AM-10:00 PM ET | Sat 8:00 AM-10:00 PM ET | Sun 7:00 AM-9:00 PM ET