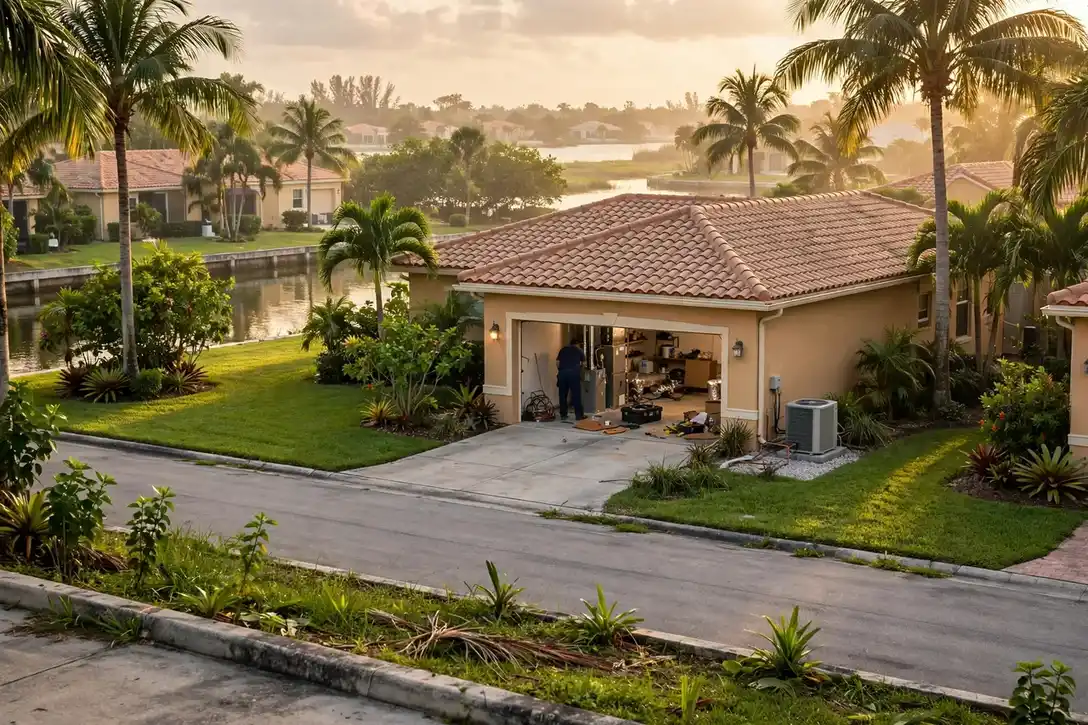


Everything on this page was computed for Cape Coral–Fort Myers and nowhere else: the problem ranking from its Census housing profile, the seasonal risks from its NOAA station record, the coverage from its own ZIP codes. TempReach USA connects you to an independent local HVAC technician; the page itself is the homework, done in public, so the call you make is an informed one.
Call center hours: Mon-Fri 7:00 AM-10:00 PM ET | Sat 8:00 AM-10:00 PM ET | Sun 7:00 AM-9:00 PM ET
The median Cape Coral–Fort Myers home was built in 1995; 20.7% of the stock predates 1980, and the pattern this metro's own data ranks first is humidity burden on homes and cooling systems. TempReach USA is a referral service, not an HVAC company: one call connects you with an independent local HVAC technician serving your ZIP code.
Start with the raw material: 792,692 people, 430,243 housing units, and a housing stock whose middle home was built in 1995. That single date organises everything on this page. On one side of it stand the older districts — 2.8% of homes predate 1960, 20.7% predate 1980 — heated and cooled by systems renewed in pieces for decades, in homes across Lee. On the other side, the 42.6% built since 2000 run matched modern equipment, and fail in the newer ways. A Cape Coral–Fort Myers technician reads a home's build year the way a doctor reads a chart: it predicts, before a single panel is opened, which systems deserve suspicion first.
The pre-1980 stock is where most of the metro's HVAC character lives. Homes from those decades in Lee County and across Lee were built with duct layouts from the first age of central systems, furnaces and condensers that have since been renewed piecemeal, and insulation standards from another era, and each of those choices is now at or beyond the age its makers expected of it. Owner-occupiers hold 74.0% of the metro's homes, so most of the people reading this page are reading about a system they own outright — one whose failures arrive as surprises only if nobody has looked at the pattern: cooling fading a little each summer, a furnace recovering a little more slowly, one room drifting a little further from the thermostat.
Growth wrote this metro's newest HVAC chapter in matched equipment and planned ducts: systems sized as a single design, controls by the catalogue, outdoor units placed by the plat across the subdivisions near Lehigh Acres and Fort Myers. The chapter is young — its systems have decades in hand — but it is not exempt from the metro's arithmetic: 4,046 cooling degree days of demand work its condensers hard, and the winters test its heat pumps with the same cold that tests the oldest furnace in Lee County.
The climate written over all of it comes from the NOAA station at FT MYERS PAGE FLD AP, FL US: an average year brings 252 heating degree days, 4,046 cooling degree days and 57.41 inches of precipitation. Those are not abstractions to a furnace or a condenser — they set how many hours a heating system runs each winter, how hard a cooling system cycles in July, and how much moisture every coil has to pull out of the indoor air. The problem sections that follow are selected by exactly these numbers, combined with the housing-age profile above.
Two public records, one metro: what was built here, and what the sky does to it.
Lay the eras side by side instead: 2.8% pre-1960 (12,047 homes), 17.9% from 1960-1979 (77,013), 36.7% from 1980-1999 (157,899), and 42.6% since 2000 (183,284). No single era tells the story — the proportions among them do, and those proportions are different in every metro this site covers.
Growth is the headline in Cape Coral–Fort Myers: the post-2000 band is the largest, much of it subdivisions fitted with matched modern systems and ductwork designed as a single plan. The work here is young-stock work — first replacements arriving in waves as whole streets age together, heat pumps standard where their neighbours have furnaces, controls and sensors failing in preference to iron. The metro's older pockets still generate the deep problems, but the volume of its HVAC future is being written in the new subdivisions.
Second in the table, the 1980-1999 band: 157,899 homes, 36.7% of the metro. Its systems are mature rather than ancient — ducts still sound, first-generation efficiency equipment wearing toward its verdicts, controls reaching their wear points in waves — and its HVAC is the schedulable kind: work that rewards being booked before it becomes urgent.
Translate the climate record into HVAC terms and it comes out as three working conditions. Condition one, the freeze count — 0.1 nights a year when a heating failure stops being a comfort issue and becomes a household one. Condition two, the heat count — 120.3 days that load condensers, ducts and tempers simultaneously. Condition three, the moisture: 57.41 inches of precipitation arriving as humidity the cooling coil must remove. Cape Coral–Fort Myers's systems are engineered, installed and aged inside those three conditions, and their failures carry the conditions' fingerprints.
Hold the two halves together and the rest of this page explains itself: the problems ranked highest here are the ones where Cape Coral–Fort Myers's dominant housing era and its climate record overlap. Change either dataset and the ranking changes — which is precisely why this profile is rebuilt from the records for every metro instead of carried over from the last one.
Sequenced by this metro's own problem ranking, not by a national catalogue order.
Tight houses need deliberate breathing. A ventilator exchanges stale air for fresh while recovering energy between the streams — the managed version of what leaky construction used to do by accident, with filtration on the intake.
Across Cape Coral–Fort Myers's 319,588 households, the air quality diary follows the building map. The tight new subdivisions near Lehigh Acres ask about ventilation and the chemistry of new materials; the the 1990s districts ask about dust, infiltration and the crawl spaces under raised floors; the households in between ask about allergies in the pollen months. One service name, three different sciences — which is why the visit begins with questions about the house and the people in it, not with a product sheet. The FT MYERS PAGE FLD AP, FL US record — 252 heating degree days, 4,046 cooling — is the backdrop Lee County technicians plan around.
Air quality demand in this metro is written by its sealed seasons: 120.3 hot days with the windows shut around the cooling, 0.1 freezing nights with them shut around the heat. The 183,284 post-2000 homes hold their air tightest; the older districts around Lehigh Acres exchange theirs with attics and crawl spaces.
Age informs an AC repair decision without deciding it — a sound system with a failed motor earns its repair, and an honest diagnosis in Cape Coral–Fort Myers will tell you which side of that line your unit stands on.
Cooling failure in Cape Coral–Fort Myers is rarely random. It bunches on the first serious heat wave, again in the late-summer grind, and it concentrates where the equipment is oldest — the pre-1980 districts, 20.7% of the metro's housing — and where the newest subdivisions' identical units reach the same wear points in the same seasons. The technician who works these streets stocks the van for both patterns: the ageing system's slow decline and the young fleet's shared failures. From Lehigh Acres to Fort Myers, the pattern repeats wherever the housing era matches.
The local caseload behind this service is written in the climate figures: 4,046 cooling degree days a year and 120.3 days at 90 or above, pressing on a cooling fleet whose oldest members serve the 89,060 pre-1980 homes — in Bonita Springs (54,830 residents) as much as in the oldest districts.
The maintenance rhythm is light but real — washable filters rinsed on cycle, drains checked before they drip — and Cape Coral–Fort Myers handovers demonstrate it unit by unit rather than mentioning it in passing.
Ductless work in Cape Coral–Fort Myers also follows the housing nobody else can easily serve: the historic core around Cape Coral, where walls were never built for ducts, and the accessory dwellings and in-law spaces appearing across Lee. Each installation is a small design project — line-set routes, condensate paths, the outdoor unit's placement — fitted to a building that predates the very idea of central air. Done well, the result is the quietest heating and cooling in the house. The 57.41 inches of rain in an average year here is part of the story too — humidity loads every cooling coil in the metro.
Scale the question by the Census count and it stays concrete: 430,243 housing units, a share of them holding rooms — additions, conversions, finished spaces — that no duct serves. The mini-split visit exists to give one of those rooms its own climate, sized to its exposure and use.
Cape Coral–Fort Myers homes heat through 252 heating degree days and cool through 4,046 cooling degree days a year, so the blower runs in both seasons and the ducts never rest — which is why what has settled in them matters here in every month, not just one.
Replacement in Cape Coral–Fort Myers begins with a load calculation across Lee: the independent local professional measures the home — not the old unit's label — and quotes the full scope before work begins.
From Cape Coral to Bonita Springs, a no-heat call through TempReach USA reaches a local professional whose visit includes the exchanger and venting checks that furnace work owes a Cape Coral–Fort Myers household.
Heating installation in Cape Coral–Fort Myers starts with a heat-loss calculation across Lee: the independent local professional measures the home's loss, inspects ducts and venting, and quotes the full scope before work begins.
From Cape Coral to Bonita Springs, Cape Coral–Fort Myers heat pump calls through TempReach USA reach a local professional who explains findings plainly and quotes after assessing — in the heating season and the cooling season alike.
Across Lee, one climate fact shapes the configuration: 252 heating degree days against 4,046 cooling degree days tells whether the control's year is mostly a heating story, mostly a cooling story, or a genuine heat pump balancing act.
Across Lee, the service record is the scarcest asset: with a median build year of 1995 across 430,243 homes, many systems around Cape Coral have no documented history — and a first tune-up's baseline is what every later decision stands on.
In Cape Coral–Fort Myers, emergency means weather-relative: 252 heating degree days put no-heat calls on a freezing clock each winter, while 4,046 cooling degree days make a dead system a health question each summer — the call center triages against both, using the hours shown on this page.
Cape Coral–Fort Myers's commercial buildings span every era around a median build year of 1995 — and with the era goes the equipment, from aging single units over old storefronts to multi-zone systems in new developments, all serviced from a per-unit record.
Ask where this metro's HVAC diary fills up and the answer is a short story: Humidity burden on homes and cooling systems first, air conditioners overworked by extreme heat close behind, and the services that answer them doing the bulk of the booked work. Everything else on the list above is the supporting cast — necessary, frequent enough, but not what Cape Coral–Fort Myers's housing stock, at its age and in its climate, principally demands. Read the service list as a weather report for the metro's systems and it stops looking like a catalogue.
Selected and ranked from this metro's housing-age profile and climate record — not copied from another city's page.
The condensate drain is the burden's ledger, and in a humid Cape Coral–Fort Myers season it runs like a small stream. Every gallon down that drain is water the coil pulled from the indoor air — evidence the system is drying as well as cooling. When the drain slows or clogs, the evidence turns: pans fill, safety switches stop the system, and the moisture the coil collected finds its way back into the house's air and materials. Drain care is therefore not a footnote of humidity work but a central chapter: a clear, trapped, correctly sloped drain line is what lets the system's drying actually leave the building. Households in the metro's humid months who learn to check that one line know more about their system's real condition than the thermostat ever tells them.
Judge a home's moisture by its wettest week, not its average one. Averages flatter: in Cape Coral–Fort Myers, an average year at FT MYERS PAGE FLD AP, FL US delivers 57.41 inches of rain, but the burden arrives in episodes — the saturated stretch when the ground is wet, the air is wet, and the house's every surface is trading moisture with both. In that week the closet smells, the registers sweat, and the system's drying margin is audited honestly. The homes that pass the audit share a profile rather than a product: sources managed, a system sized and set up to run long enough to dry, a drain that carries the evidence away, and occupants who read indoor humidity the way they read temperature. Moisture problems are patient; they wait for the wet week. The preparation that defeats them is exactly as patient, and considerably cheaper in attention than in consequence.
The timing is the signature: humidity complaints in Cape Coral–Fort Myers peak in the wet, saturated stretches rather than the hottest dry ones — the pattern of a moisture load, not a temperature load, announcing itself through the same equipment.
Extreme heat does not ask an air conditioner to work a little harder; it changes the job entirely. In Cape Coral–Fort Myers, the record at FT MYERS PAGE FLD AP, FL US counts 120.3 days a year at 90 degrees or more, and on those days a system sized for an average afternoon runs from late morning to well past dark without a pause. Compressors heat-soak, capacitors weaken a fraction with every hard start, contactors pit and stick, and a refrigerant charge that was slightly low in spring becomes the reason the house will not pull down in July. The failure rarely arrives as a single broken part. It arrives as a system that has been spending its reserves for weeks: longer run times, a house that reaches the set point later each day, an outdoor unit that sounds strained at startup. By the time it stops outright, it has usually been reporting the strain for a while. A local technician reading that pattern checks the electrical wear items first, then charge and airflow, because heat-season failures in Lee County follow the load, and the load is written in the climate record.
Households tend to judge a cooling system by its mildest day. On a mild day an overworked system still copes, still reaches the setting, still argues for another season. Judge it by its hottest week instead: the hours it ran without pausing, the afternoons the house drifted upward, the nights it needed to recover. In Cape Coral–Fort Myers, FT MYERS PAGE FLD AP, FL US keeps the honest record of that week — 120.3 days a year over 90 degrees is the examination the system actually sits. The homes that fare well in it are rarely the ones with the newest equipment; they are the ones whose owners believed the early chapters of the strain story — the lengthening runs, the fading afternoons — and had the wear items checked while the system was still arguing its case.
Count the demand the way the equipment experiences it: 4,046 cooling degree days a year, with the peak delivered in afternoons when the temperature difference the system must work against is at its widest. In that arithmetic, a marginal system is not unlucky — it is simply outnumbered.
Some rooms should never have been asked to share. The converted garage, the sunroom, the addition over the back, the finished attic in a Cape Coral–Fort Myers home — these spaces have different walls, different exposure and different loads from the original house, and tying them into the original duct network asked a system sized for one building to serve two. Ductless mini-split equipment answers precisely there: a dedicated indoor unit for the problem space, its own thermostat, capacity matched to that room's actual load, and no dependence on a trunk line that was never designed to reach it. The original system is relieved of its most unreasonable duty at the same moment the room gains honest service. That is why the ductless conversation so often begins with a single room's complaint rather than a whole-house plan — the room was the problem, and the room is what gets its own equipment.
Judge a multi-room home at its extremes, not at its thermostat. The thermostat sits, by convention, in the home's most average room, and it will report contentment while the nursery roasts and the end office freezes. The extremes are the system's true report card, and in Cape Coral–Fort Myers they follow the climate record honestly: 120.3 hot days audit the upstairs, 0.1 freezing nights audit the far rooms over unheated spaces, and the household learns its home's real climate map from the rooms it avoids in each season. Homes whose extremes are comfortable have been sorted — by design, by correction or by dedicated equipment — and homes whose extremes are endured are carrying an unsorted map. The sorting is a solvable problem in essentially every case; what it cannot survive is being mistaken for an equipment failure and treated with a bigger version of the same single answer.
Look at the adaptation evidence in any affected Cape Coral–Fort Myers home: the portable heater in the end room, the fan that lives in the upstairs hall, the bedroom doors propped for airflow. Households instrument this pattern with their own purchases long before anyone measures it — the adaptations are the data, waiting for a diagnosis.
A generation change is moving through Cape Coral–Fort Myers's cooling equipment, and it arrives one repair decision at a time. For decades, residential systems ran on R-22; production and import of that refrigerant ended in the United States in 2020, so the supply that remains is reclaimed stock, and servicing a leaking R-22 system means weighing a scarce, aging refrigerant against the age of the machine it serves. Newer systems moved to R-410A, and equipment now arriving uses lower-impact refrigerants such as R-454B, with their own handling and code requirements. The transition matters to a homeowner at specific moments: when an older system needs a charge, when a coil or compressor fails on a machine whose refrigerant is effectively retired, when a repair quote must be compared honestly against replacement. Nothing about it is a reason for panic — R-22 systems are not banned from being serviced — but every significant repair on one is now also a planning conversation, and households in Cape Coral–Fort Myers with equipment from the R-22 era benefit from having it before the hottest week, not during it.
Judge a refrigerant-era system by its leak history and its trend, not by a single charge reading. One low reading after many tight years is an event; a pattern of small losses is a biography, and the biography is what the economics should be based on. Cape Coral–Fort Myers's climate record loads the question at both ends — a leaking system underperforms exactly when FT MYERS PAGE FLD AP, FL US's 120.3 hot days demand its full capacity, and its owner pays for refrigerant and lost performance simultaneously. The households that navigate this transition well keep one habit: they can state their system's age, refrigerant and last three repairs without looking them up. That small command of the facts converts an industry-wide generational change into a single household's managed decision, which is the scale at which it was always going to be decided anyway.
The regulatory facts are the foundation: R-22 production and import ended in the United States in 2020, leaving reclaimed stock as the supply, while new equipment has moved through R-410A to the current lower-impact generation. In Cape Coral–Fort Myers every generation still stands in service — the transition is not coming to this metro; it is distributed across it, yard by yard.
The season does not need to be survived in one heroic effort; it needs to be read in chapters. Early heat exposes weak starting parts. The long middle stretch exposes capacity — systems sized or charged marginally fall behind a degree at a time while running without pause. The humid weeks expose drainage, as condensate runs at full volume and a slowing drain announces itself. Late season exposes fatigue, when components worn by months of starts begin to fail on ordinary days. Between chapters, the household's work is mostly attention: a filter's condition, a drain's flow, the sound of a startup, the temperature at a far register. The season is the metro's longest HVAC fact — 4,046 cooling degree days of it — and it rewards the households that pace their systems through it instead of discovering it all at once.
The season loads Cape Coral–Fort Myers's systems the way its record at FT MYERS PAGE FLD AP, FL US says it will: 252 heating degree days against 4,046 cooling degree days in an average year, against a housing stock whose median build year is 1995. The households that read the season early — filters, drains, a system run before the extreme weeks — are the ones whose calls stay schedulable.
There is a final depth to the pattern: humidity taxes the cooling system itself. A coil spending its capacity on water is a coil with less capacity for temperature, so in Cape Coral–Fort Myers's humid months the effective size of every system shrinks exactly when the load peaks. Run times stretch, wear accumulates, and the strain story of the hot season is partly a moisture story in disguise. The condensate that leaves through the drain is capacity spent invisibly; the comfort that households feel is what remains. That is why experienced local practice treats a humidity complaint as system information rather than a comfort preference — the sticky house is reporting a load its equipment was never explicitly sized for, and the report deserves the same seriousness as a noise or a stop. The number that settles it is a humidity reading; everything before that number is weather talk.
Strip the pattern down to its inputs and the ranking stops being mysterious: 319,588 households depending on systems installed across a median build year of 1995, in a climate that swings between 120.3 days of serious heat and 0.1 freezing nights. Whatever pattern a metro with those inputs manufactures most, it manufactures here — the lead position is less a title than a consequence, recalculated from the same public records any sceptic can check.
The first visit follows a short, diagnostic list — each item ruling a branch of the problem in or out:
PROBLEM SOLUTION
Population 206,387
Population 127,391
Population 91,730
Population 54,830
Population 44,189
Population 37,258
Population 18,252
Population 14,290
Population 13,578
Population 13,145
Population 9,603
Population 8,198
Also in the Cape Coral–Fort Myers metro: Sanibel (population 6,402), Three Oaks (population 6,037).
Beyond Cape Coral itself, the metro takes in Lehigh Acres (127,391 residents), Fort Myers (91,730) and the rest of the communities in the grid above — each fitted with heating and cooling in its own building era, which is why two streets in the same metro can need entirely different HVAC conversations. The ZIP list below is the full coverage footprint: if your code is on it, this page was written about your housing stock.
Also on the Cape Coral–Fort Myers map: Bonita Springs (54,830), North Fort Myers (44,189), Estero (37,258), San Carlos Park (18,252), Iona (14,290) — communities spread across Lee, each with housing from its own growth years. A technician routed through TempReach USA to any of them is working from this same page: the metro data does not change at the city limit, but the housing on your street — its age, its equipment, its attic — is what the visit is really about.
Start with Cape Coral itself: 206,387 residents, 26.0% of the metro — the centre the rest of the map orbits. Lehigh Acres (127,391) and Fort Myers (91,730) form the next ring out, housing with its own building decades and its own equipment generations. Beyond them the metro thins into the smaller communities in the grid above, each a few thousand households deep — small in population, identical in one respect: their systems answer to the same eras and the same weather as the big city's.
Administratively the metro is drawn from Lee — 1 in all — with Lee County at its centre. County lines do not change how a system runs, but they do shape the paperwork around the work: permits, inspections and code details are county and city business, which is one reason the professional who serves your street is a local one.
Three neighbouring coverage areas begin where this one ends: Punta Gorda, FL, some 24 miles off; Naples, FL, 47 miles; and North Port–Sarasota, FL, 60 miles. Each keeps its own page because each keeps its own numbers — a different median build year, a different climate station, a different problem ranking. Boundary households should trust the ZIP list over the map: the code, not the compass, assigns the dataset.
Set Cape Coral–Fort Myers among its neighbours and the contrasts sharpen the profile: Punta Gorda, FL — metro population 217,212, median build year 1990 — sits 24 miles away; Naples, FL (417,131, median 1996) 47 miles; North Port–Sarasota, FL (948,158, median 1988) 60 miles. Three different housing stocks under three nearby skies, which is why each keeps its own page and its own problem ranking rather than borrowing this one.
Ratios tell the metro's story compactly. Renters occupy 26.0% of homes; owners hold the rest. For every home built since 2000 there are 0.5 from before 1980. Spread the stock across the coverage map and each ZIP code carries about 12,654 housing units — the density at which era patterns repeat street after street instead of scattering, and at which a routed round of calls stays inside a few districts.
The Cape Coral–Fort Myers record in one line — median home age: 31 years · owner-occupied homes: 236,495 · renter-occupied homes: 83,093 · pre-1960 homes per covered ZIP code: 354 · heating-to-cooling degree-day ratio: 0.06 · average rainfall: 1,458 mm a year.
County pages carry the local detail — land area, climate normals and the heating and cooling pressures on the ground in each county.
More plain-language help: the TempReach USA heating & cooling guides
TempReach USA routes your call to an independent local heating and cooling professional serving Cape Coral–Fort Myers — the assessment and the work are theirs.
Call center hours: Mon-Fri 7:00 AM-10:00 PM ET | Sat 8:00 AM-10:00 PM ET | Sun 7:00 AM-9:00 PM ET